
![]()
![]()

![]()
![]()
 Page
Page
1 Arsenic
1.1 General
1.2 Previous HIL
1.3 Significance of Exposure Pathways
1.3.1 Oral Bioavailability
1.3.2 Dermal Absorption
1.3.3 Inhalation of Dust
1.3.4 Plant Uptake
1.3.5 Intakes from Other Sources – Background
1.4 Identification of Toxicity Reference Values
1.4.1 Classification
1.4.2 Review of Oral Information
1.4.3 Assessment of End Points – Oral Exposures
1.4.3.1 Existing Oral DoseResponse Approaches Australia
1.4.3.2 Oral DoseResponse Approaches - International
1.4.4 Inhalation Values
1.4.5 Recommendation
1.5 Calculated HILs
1.6 References
2 Beryllium
2.1 General
2.2 Previous HIL
2.3 Significance of Exposure Pathways
2.3.1 Oral Bioavailability
2.3.2 Dermal absorption
2.3.3 Inhalation of Dust
2.3.4 Plant Uptake
2.3.5 Intakes from Other Sources – Background
2.4 Identification of Toxicity Reference Values
2.4.1 Classification
2.4.2 Review of Available Values/Information
2.4.3 Recommendation
2.5 Calculated HILs
2.6 References
3 Boron
3.1 General
3.2 Previous HIL
3.3 Significance of Exposure Pathways
3.3.1 Oral Bioavailability
3.3.2 Dermal absorption
3.3.3 Inhalation of Dust
3.3.4 Plant Uptake
3.3.5 Intakes from Other Sources – Background
3.4 Identification of Toxicity Reference Values
3.4.1 Classification
3.4.2 Review of Available Values/Information
3.4.3 Recommendation
3.5 Calculated HILs
3.6 References
4 Cadmium
4.1 General
4.2 Previous HIL
4.3 Significance of Exposure Pathways
4.3.1 Oral Bioavailability
4.3.2 Dermal absorption
4.3.3 Inhalation of Dust
4.3.4 Plant Uptake
4.3.5 Intakes from Other Sources – Background
4.4 Identification of Toxicity Reference Values
4.4.1 Classification
4.4.2 Review of Available Values/Information
4.4.3 Oral (and Dermal) Intakes
4.4.4 Inhalation Exposures
4.4.5 Recommendation
4.5 Calculated HILs
4.6 References
5 Chromium VI
5.1 General
5.2 Previous HIL
5.3 Significance of Exposure Pathways
5.3.1 Oral Bioavailability
5.3.2 Dermal absorption
5.3.3 Inhalation of Dust
5.3.4 Plant Uptake
5.3.5 Intakes from Other Sources – Background
5.4 Identification of Toxicity Reference Values
5.4.1 Classification
5.4.2 Review of Available Values/Information
5.4.2.1 Oral Intakes
5.4.2.2 Inhalation Exposures
5.4.3 Recommendation
5.5 Calculated HILs
5.6 References
6 Cobalt
6.1 General
6.2 Previous HIL
6.3 Significance of Exposure Pathways
6.3.1 Oral Bioavailability
6.3.2 Dermal absorption
6.3.3 Inhalation of Dust
6.3.4 Plant Uptake
6.3.5 Intakes from Other Sources – Background
6.4 Identification of Toxicity Reference Values
6.4.1 Classification
6.4.2 Review of Available Values/Information
6.4.3 Recommendation
6.5 Calculated HILs
6.6 References
7 Copper
7.1 General
7.2 Previous HIL
7.3 Significance of Exposure Pathways
7.3.1 Oral Bioavailability
7.3.2 Dermal absorption
7.3.3 Inhalation of Dust
7.3.4 Plant Uptake
7.3.5 Intakes from Other Sources – Background
7.4 Identification of Toxicity Reference Values
7.4.1 Classification
7.4.2 Review of Available Values/Information
7.4.3 Recommendation
7.5 Calculated HILs
7.6 References
8 Lead
8.1 General
8.2 Previous HIL
8.3 Significance of Exposure Pathways
8.3.1 Oral Bioavailability
8.3.2 Dermal absorption
8.3.3 Inhalation of Dust
8.3.4 Plant Uptake
8.3.5 Intakes from Other Sources – Background
8.4 Identification of Toxicity Reference Values
8.4.1 Classification
8.4.2 Review of Available Values/Information
8.5 Calculated HILs
8.5.1 HILs
8.6 References
9 Manganese
9.1 General
9.2 Previous HIL
9.3 Significance of Exposure Pathways
9.3.1 Oral Bioavailability
9.3.2 Dermal absorption
9.3.3 Inhalation of Dust
9.3.4 Plant Uptake
9.3.5 Intakes from Other Sources – Background
9.4 Identification of Toxicity Reference Values
9.4.1 Classification
9.4.2 Review of Available Values/Information
9.4.3 Recommendation
9.5 Calculated HILs
9.6 References
10 Mercury
10.1 General
10.2 Previous HIL
10.3 Significance of Exposure Pathways
10.3.1 Oral Bioavailability
10.3.2 Dermal absorption
10.3.3 Inhalation of Dust
10.3.4 Plant Uptake
10.3.5 Intakes from Other Sources – Background
10.4 Identification of Toxicity Reference Values
10.4.1 Classification
10.4.2 Review of Available Values/Information
10.4.2.1 Inorganic Mercury
10.4.2.2 Methyl Mercury
10.4.3 Recommendation
10.5 Calculated HILs
10.5.1 Inorganic Mercury
10.5.2 Methyl Mercury
10.6 References
11 Nickel
11.1 General
11.2 Previous HIL
11.3 Significance of Exposure Pathways
11.3.1 Oral Bioavailability
11.3.2 Dermal absorption
11.3.3 Inhalation of Dust
11.3.4 Plant Uptake
11.3.5 Intakes from Other Sources – Background
11.4 Identification of Toxicity Reference Values
11.4.1 Classification
11.4.2 Review of Available Values/Information
11.4.2.1 Oral
11.4.2.2 Inhalation
11.4.2.3 Identified TRVs
11.4.3 Recommendation
11.5 Calculated HILs
11.6 References
12 Selenium
12.1 General
12.2 Previous HIL
12.3 Significance of Exposure Pathways
12.3.1 Oral Bioavailability
12.3.2 Dermal absorption
12.3.3 Inhalation of Dust
12.3.4 Plant Uptake
12.3.5 Intakes from Other Sources – Background
12.4 Identification of Toxicity Reference Values
12.4.1 Classification
12.4.2 Review of Available Values/Information
12.4.3 Recommendation
12.5 Calculated HILs
12.6 References
13 Zinc
13.1 General
13.2 Previous HIL
13.3 Significance of Exposure Pathways
13.3.1 Oral Bioavailability
13.3.2 Dermal absorption
13.3.3 Inhalation of Dust
13.3.4 Plant Uptake
13.3.5 Intakes from Other Sources – Background
13.4 Identification of Toxicity Reference Values
13.4.1 Classification
13.4.2 Review of Available Values/Information
13.4.3 Recommendation
13.5 Calculated HILs
13.6 References
14 Cyanide (free)
14.1 General
14.2 Previous HIL
14.3 Significance of Exposure Pathways
14.3.1 Oral Bioavailability
14.3.2 Dermal absorption
14.3.3 Inhalation of Dust
14.3.4 Inhalation of HCN Gas
14.3.5 Plant Uptake
14.3.6 Intakes from Other Sources – Background
14.4 Identification of Toxicity Reference Values
14.4.1 Classification
14.4.2 Review of Available Values/Information
14.4.3 Recommendation
14.5 Calculated HILs
14.6 References
15 Shortened forms
Several comprehensive reviews of arsenic in the environment and its toxicity to humans are available and should be consulted for more detailed information not presented in this summary (ATSDR 2007; NRC 2001; WHO 2001; and EA 2009a). The following provides a summary of the key aspects of arsenic that are relevant to the derivation of a soil health investigation level (HIL).
Arsenic is a metalloid that can exist in four valence states (-3, 0, +3 and +5) and forms a steel grey, brittle solid in elemental form (ATSDR 2007). Under reducing conditions, arsenite (As III) is the dominant form and, in well oxygenated environments, arsenate (As V) predominates (WHO 2000). Arsenic is the 20th most commonly occurring element in the Earth’s crust, occurring at an average concentration of 3.4 ppm (ATSDR 2007).
The derivation of the HIL (HIL A = 100 mg/kg) for arsenic is presented by Langley (1991). In summary, the previous HIL was derived on the basis of the following:
Ingestion of soil and dust is considered the most significant pathway of exposure for inorganics in soil. The consideration of bioavailability and inclusion of other exposure pathways in the derivation of a soil HIL has been further reviewed, as noted below.
Most international jurisdictions have adopted a default value of 100% oral bioavailability in the derivation of investigation levels, allowing site-specific bioavailability to then be considered in further assessment. It is also understood that review of arsenic bioavailability in Australia (Ng et al. 2009) has not identified a default value.
As a note, some default bioavailability values have been adopted in the USA (based on reviews of state-specific data) as follows:
While it may not be sufficiently conservative to apply a low value as adopted by the Australian Pesticides and Veterinary Medicines Authority (APVMA) (25%), some consideration of a conservative default in Australia is presented. It is noted that bioavailability is complex; however, based on relative bioavailability data available for Australian sites (presented in Ng et al. 2009; Juhasz et al. 2003), upper values were in the range of approximately 5070% with most significantly lower than these values, and a few studies reporting upper limit values that are higher (up to 97%). Juhasz et al. (2003) suggested a worst-case value of 50% could be considered. When considering long-term exposures from soil it is overly conservative to consider the maximum bioavailability value from one particular study, as exposures will be averaged over accessible soil/dust. Hence it would be reasonable to consider a conservative value of 70% bioavailability as a reasonable upper estimate that adequately addresses arsenic that may be derived from mine sites, smelters, railway corridors and other areas where herbicides/pesticides have been used.
Roberts et al. (2002) showed monkey absorption of arsenic from pesticide-treated soil and cattle dip soil is 10.724.7%. In August 2001, the US EPA Health Effects Division’s Hazard Identification Assessment Review Committee (HIARC) evaluated the toxicology database for inorganic arsenic and established toxicological end points for incidental residential and commercial/industrial exposure risk assessments (US EPA 2001). As a key component of that assessment, HIARC established the appropriate relative bioavailability of arsenic in soil versus arsenic in water. For purposes of health risk assessment, US EPA evaluated a number of studies of relative bioavailability of arsenic (US EPA 2001). After careful consideration of data reported in the various bioavailability studies, US EPA determined that the monkey was considered an appropriate study model for humans due to its similarity in excretion and gastrointestinal absorption characteristics (US EPA 2001). The US EPA identified the comprehensive monkey study conducted by Roberts et al. (2002) as the study of choice. This study was conducted on behalf of the Florida Department of Environmental Protection (DEP) in order to specifically establish a gastrointestinal absorption efficiency factor for arsenic in soil that could be applied to soil risk assessments. The Roberts et al. (2002) study identified the maximum of the arithmetic mean value of 24.7% (for five animals and for relative bioavailability for each of five soil types) as a ‘conservative, upper bound case for any particular soil type’. While the maximum individual value reported in the study was 32.4%, the authors did not recommend this value for use as a reasonable maximum exposure (RME) value for risk assessment on the basis that ‘only under highly specific, rare circumstances is the maximum value for a particular parameter used in environmental characterisation, exposure assessment and risk assessment’ (Roberts et al. 2002). The US EPA agreed with the Florida DEP and selected 25% as an RME value for relative bioavailability for health risk assessments of arsenic in soil (US EPA 2001) and both agencies currently endorse the value of 25%. While the Roberts et al. (2002) study used five soil types typical of Florida soils, another monkey study (using a difference species) was conducted by Freeman et al. (1995) using soil near a smelter in Anaconda, Montana. The mean absolute percentage bioavailabilities, based on urinary excretion data, were 68, 19, and 14% for the gavage (soluble sodium arsenate in oral solution), house dust, and soil treatments, respectively. The values for house dust and soil are consistent with those reported by Roberts et al. (2002) for soil.
Available data from Bendigo in Victoria suggests that the bioavailability of arsenic in soil derived from mine tailings in this region commonly ranges from 1020% and is generally less than 30%. The value of 25% that is adopted by the US EPA would be appropriate in these areas.
With consideration of the above, a range of 2570% bioavailability may be appropriate for the assessment of arsenic in soil. The range of bioavailabilities considered would need to be based on suitable data in relation to source and site-specific bioavailability (where lower bioavailability values were considered appropriate).
Review of dermal absorption by the New Zealand Ministry for the Environment (MfE 2011) has noted that ‘despite the fact that skin cancer is a primary toxicological effect of concern as a result of exposure to arsenic, dermal absorption of arsenic is generally considered to be negligible. US EPA (2004) guidance uses a dermal absorption factor of 3% based on Wester et al. (1993), who examined the dermal uptake of arsenic in solution. However, recent studies on the dermal absorption of soil-absorbed arsenic in rhesus monkeys indicate that the mean dermal absorption is 0.5%, i.e. negligible (Lowney et al. 2007)’.
On the basis of the above, a dermal absorption value of 0.5% has been considered in the derivation of an HIL for arsenic in soil.
Arsenic is not volatile and inhalation exposures associated with particulates outdoors and indoors are expected to be of less significance than ingestion of soil. While likely to be negligible, potential inhalation exposures associated with dust have been considered in the HIL derived.
In the review of arsenic presented by Langley (1991), a study by Merry et al. (1986) was cited which involved evaluation of the uptake of arsenic by radishes and silverbeets in soil with concentrations ranging from 26260 ppm. The study showed ‘no concentrations that exceeded currently accepted health limits for human consumption’ Langley (1991). Langley (1991) also noted that plant growth was likely to be affected before plant concentrations were substantially elevated.
Further review of plant uptake of arsenic is presented by the UK Environment Agency (EA 2009b). This review considered studies that are based on the uptake of arsenic into green vegetables, root vegetables, tuber vegetables, herbaceous fruit, shrub fruit and tree fruit. The review provides recommendations as to relevant soil-to-plant uptake factors that are relevant for these types of produce. The recommendations from this review have been considered in the derivation of a residential HIL A and are summarised below for the range of crops considered:
Produce Group | Plant Uptake Factors (mg/kg produce fresh weight per mg/kg soil) (EA 2009b) |
Green vegetables | 0.00043 |
Root vegetables | 0.0004 |
Tuber vegetables | 0.00023 |
Tree fruit | 0.0011 |
It is noted that the inclusion of home-grown produce in the calculations presented for HIL A results in some double counting of intakes from fruit and vegetable produce (also included in background intakes). To address this in the derivation of HIL A, half the intake estimated to be derived from home-grown produce is assumed to be already accounted for in the total background intake (noted below).
The most recent Australian Total Diet Survey (ATDS) that addresses arsenic in food was published by FSANZ in 2011 (FSANZ 2011). Based on data presented in this report, dietary intake of arsenic for children aged 25 years ranges from a mean of 1.2 µg/kg/day to a 90th percentile of 2.8 µg/kg/day. These intakes are based on total arsenic in produce, rather than inorganic arsenic.
Review of background intakes from food, water, air, soil and contact with play equipment, based on available Australian data presented by APVMA (2005), suggests background intakes of inorganic arsenic by young children may average 0.62 µg/kg/day. Further review of inorganic arsenic intakes by the Joint FAO/WHO Expert Committee on Food Additives (WHO 2011a) indicated that for populations not located in areas of arsenic-contaminated groundwater, intakes by young children ranged from 0.141.39 µg/kg/day. On the basis of the range of intake estimations available, a reasonable estimation of 50% of the oral toxicity reference value (TRV) from sources other than soil has been assumed. It is noted that the inclusion of home-grown produce in the calculations presented for HIL A results in some double counting of intakes from fruit and vegetable produce (addressed when assessing intakes from home-grown produce).
Intakes from inhalation exposures are low (around 0.0017 µg/kg/day (APVMA 2005)), comprising <1% of the inhalation TRV adopted.
With respect to arsenic toxicity and the identification of appropriate toxicity reference values, a number of issues need to be considered. These include:
These are discussed below.
The International Agency for Research on Cancer (IARC) has classified arsenic and inorganic arsenic compounds as Group 1 ‘carcinogenic to humans’ (IARC 2012).
Arsenic is a known human carcinogen, based on human epidemiological studies that show skin and internal cancers (in particular, bladder, liver and lung) associated with chronic exposures to arsenic in drinking water. The research available on arsenic carcinogenicity is dominated by epidemiological studies (which have limitations) rather than animal studies. This differs from carcinogenic assessments undertaken on many other chemicals. The principal reason for the lack of animal studies is because arsenic has not been shown to cause cancer in rodents (the most common species used in animal tests), due to interspecies differences between rodents and humans.
Review of arsenic by IARC (2012) has concluded the following:
Revision to the WHO guidelines on drinking water (WHO 2011b) adopted a practical value based on the analytical limit of reporting rather than based on a doseresponse approach. The oral slope factor derived by the US has not been used to derive a guideline, as the slope factor is noted by WHO as likely to be an overestimate.
US EPA reviews have retained the use of a non-threshold approach, based on sufficient supporting evidence associated with increased rates of bladder and lung cancer (for inhalation exposures (US EPA 2001)). The US EPA approach adopted follows a review by the NRC (2001) which concluded that ‘… internal cancers are more appropriate as end points for risk assessment than non-melanoma skin cancers’. Slope factors relevant for the assessment of these end points range from 0.423 (mg/kg/day)-1. The use of a non-threshold approach (slope factor), however, is more by default by following the US EPA Carcinogenic Guidelines (US EPA 2005), as there remains uncertainty on the carcinogenic MOA for arsenic (Sams et al. 2007). Further research is required to define and review the MOA prior to the US revising the doseresponse approach currently adopted. Inherent in the current US approach (where a non-threshold slope factor is derived) are some key uncertainties that likely result in an overestimate of risk (Boyce et al. 2008), which include (SAB 2005, Brown 2007, Lamm & Kruse 2005 and Chu & Crawford-Brown 2006):
Review of recent studies presented by Boyce et al. (2008) has indicated that, for carcinogenic effects associated with arsenic exposure, a linear (or non-threshold) doseresponse is not supported (also note discussion by Clewell et al. 2007). This is based on the following:
Hence the default approach adopted by the US EPA in adopting a non-threshold approach to the assessment of the carcinogenic effects associated with arsenic exposure is not well supported by the available data. This is consistent with the most recent Australian review available (APVMA 2005). The review conducted considered current information on arsenic carcinogenicity and genotoxicity which noted the following:
‘Although exposure to high concentrations of inorganic arsenic results in tumour formation and chromosomal damage (clastogenic effect), the mechanism by which these tumours develop does not appear to involve mutagenesis. Arsenic appears to act on the chromosomes and acts as a tumour promoter rather than as an initiator …’. ‘Furthermore, the epidemiological evidence from occupational exposure studies indicates that arsenic acts at a later stage in the development of cancer, as noted with the increased risk of lung cancer mortality with increasing age of initial exposure, independent of time after exposure …’ ‘Hence arsenic appears to behave like a carcinogen which exhibits a threshold effect. This would also be conceptually consistent with the notion that humans have ingested food and water containing arsenic over millennia and so the presence of a threshold seems likely. Nevertheless the mechanism by which tumour formation develops following arsenic exposure has been and still continues to be a source of intensive scientific investigation.’
On the basis of the above the use of a threshold doseresponse approach for the assessment of carcinogenic effects associated with arsenic exposure is considered appropriate and has been adopted in the derivation of soil HILs.
The review of arsenic by the New Zealand Ministry for the Environment (MfE 2011) noted that, while there is general consensus that arsenic is likely to act indirectly on DNA in a sub-linear or threshold manner, it is considered that there is insufficient data available to determine a ‘well-defined non-linear doseresponse’. For this reason the derivation of the New Zealand soil guideline values has adopted a non-threshold (linear) approach for arsenic (i.e. adopting a default non-threshold approach similar to that adopted by default by the US EPA). This differs from the approach adopted in Australia.
Arsenic intakes (oral) have been considered in Australia in the derivation of the current HIL (Langley 1991) and the Australian Drinking Water Guidelines (ADWG) (NHMRC 2011). The following can be noted from these guidelines:
A review of arsenic toxicity was conducted by APVMA (2005) where a threshold approach was considered appropriate (noted above). A threshold value of 3 μg/kg/day was derived by the Australian and New Zealand Food Authority (ANZFA, now Food Standards Australia New Zealand (FSANZ)) in 1999, and considered in the APVMA (2005) review. The review considered that skin cancers appear to be the most sensitive indicator of carcinogenicity of inorganic arsenic in humans and, based on epidemiological studies, a threshold of 2.9 μg/kg/day (rounded to 3 μg/kg/day) can be obtained. This threshold is the value adopted as a provisional tolerable daily intake (PTDI) by FSANZ (FSANZ 2003), similar to the former PTWI available from WHO (noted above). This approach has been considered by APVMA for all intakes of arsenic (oral, dermal and inhalation). The evaluation has not been further updated.
Evaluation of arsenic by JECFA (WHO 2011a) considered the available epidemiological data in relation to the increased incidence of lung cancer and urinary tract cancer associated with exposure to arsenic in water and food. Using the data associated with these end points, JECFA derived a benchmark dose lower confidence limit for a 0.5% increased incidence (BMDL0.5) of lung cancer (most sensitive end point) of 3 μg/kg/day (ranging from 27 μg/kg/day). Uncertainties associated with the assumptions associated with total exposure, extrapolation of the BMDL0.5 and influences of the existing health status of the population were identified. Given the uncertainties and that the BMDL0.5 was essentially equal to the PTWI (WHO 1989), the PTWI was withdrawn. No alternative threshold values were suggested by JECFA, as the application of the BMDL needs to be addressed on a regulatory level, including when establishing guideline levels.
The review conducted by JECFA is generally consistent with that conducted by the European Food Safety Authority (EFSA) Panel on Contaminants in the Food Chain (CONTAM) (EFSA 2010). The review concluded that the PTWI was ‘no longer appropriate as data is available that shows inorganic arsenic causes cancer of the lung and bladder in addition to skin, and that the range of adverse effects had been reported at exposures lower than those reviewed by the JECFA’ in establishing the PTWI. Modelling conducted by EFSA considered the available epidemiological studies and selected a benchmark response (lower limits) of 1% extra risk (BMDL01). BMDL01 range from 0.38 μg/kg/day for cancers of the lung, bladder and skin. The CONTAM Panel (EFSA 2010) concluded that the overall range of BMDL01 values of 0.38 μg/kg/day should be used for the risk characterisation of inorganic arsenic rather than a single reference point, primarily due to the number of uncertainties associated with the possible doseresponse relationships considered. On this basis it would not be appropriate to consider just one value in the range presented.
The derivation of a soil HIL requires the identification of an appropriate TRV, rather than a wide range of values, that is considered adequately protective of the population potentially exposed. The determination of an appropriate TRV for arsenic in soil in Australia has therefore considered the following:
In view of the above, consideration of the lower end of the range of BMDL values available from WHO (2011a) and EFSA (2010) is not considered appropriate for the Australian population.
Based on the above considerations, a TRV of 2 µg/kg/day has been adopted in the derivation of a soil HIL. The TRV has been selected on the basis of the following:
Due to the level of uncertainty in relation to determining a single TRV for the assessment of arsenic exposures, the oral TRV used for the derivation of the soil HIL has not been considered to be a definitive value (refer to the calculations presented below). In addition, the approach adopted is based on developing science that should be reviewed in line with further developments in both science and policy.
Less data is available with respect to inhalation exposures to arsenic, though trivalent arsenic has been shown to be carcinogenic via inhalation exposures (with lung cancer as the end point). Review of the relevant mechanisms for carcinogenicity by RIVM (2001) suggests that the mechanism for arsenic carcinogenicity is the same regardless of the route of exposure. Hence a threshold is also considered relevant for the assessment of inhalation exposures. This is consistent with the approach adopted in the derivation of the previous arsenic HIL (Langley 1991) and in the review undertaken by APVMA (2005). While NEPC and APVMA adopted the oral PTWI as relevant for all routes of exposure, RIVM (2001) has derived an inhalation-specific threshold value. The RIVM (2001) review identified that the critical effect associated with chronic inhalation exposures in humans is lung cancer. The lowest observable adverse effect concentration (LOAEC) for trivalent arsenic associated with these effects is 10 μg/m3 (based on the review by ATSDR 2007). Applying an uncertainty factor of 10 to address variability in human susceptibility, a tolerable concentration (TC) in air of 1 μg/m3 was derived.
Given the above, there is some basis for the assessment of inhalation exposures to arsenic to adopt an appropriate threshold value but the available epidemiological studies associated with exposures in copper smelters suggest a linear or non-threshold approach may be relevant. The WHO (2000) review of arsenic also suggested the use of a linear (non-threshold) approach to the assessment of inhalation exposures to arsenic. The assessment presented is limited and essentially adopts the US approach with no discussion or consideration of the relevance of the linear model adopted. The review by WHO (2001) with respect to inhalation exposures and lung cancer provides a more comprehensive review and assessment. The review presented identified that a linear doseresponse relationship is supported by the occupational and epidemiological studies. The three key studies associated with copper smelters in Tacoma, Washington (USA), Anaconda, Montana (USA) and Ronnskar (Sweden) (as summarised by WHO 2001) demonstrate a statistically significant excess risk of lung cancer at cumulative exposure levels of approximately 0.75 mg/m3 per year.
The relevance of inhalation values derived from studies near smelters to the assessment of contaminated arsenic in soil in areas away from smelters is not well founded. Hence it is recommended that a threshold approach is considered for the assessment of inhalation exposures associated with arsenic in soil. The threshold TC derived by RIVM (2001) of 1 μg/m3 is lower than the cumulative exposure value identified by WHO (2001) of 750 μg/m3.years as statistically associated with an increase in lung cancer. The values are considered reasonably comparable if the exposure occurs over a period of 40 years and appropriate uncertainty factors are applied to convert from a lowest observable adverse effect level (LOAEL) to a NOAEL. In addition the TC is consistent with the TC05 value derived by Health Canada (1993) associated with lung cancer in humans and an incremental lifetime risk of 1 in 100,000. The value adopted is lower than the recommended PTDI adopted for the assessment of oral intakes (when the TC is converted to a daily intake). Hence use of the RIVM TC has been considered appropriate and adequately protective of all health effects associated with inhalation exposures that may be derived from soil, including carcinogenicity.
On the basis of the discussion above the following toxicity reference values (TRVs) have been adopted for arsenic in the derivation of HILs:

The following comments relate to the derivation of an HIL A (the most sensitive exposure scenario) for arsenic:
On the basis of the above the following HILs have been derived for arsenic (refer to Appendix B for equations used to calculate the HILs and Appendix C for calculations):
HIL Scenario | HIL* (mg/kg) | Percentage Contribution from Exposure Pathways | |||
Ingestion of Soil/Dust | Ingestion of Home-grown Produce | Dermal Absorption of Soil/Dust | Inhalation (dust) | ||
Residential A | 100 | 86 | 9 | 5 | <1 |
Residential B | 500 | 81 | -- | 19 | <1 |
Recreational C | 300 | 90 | -- | 10 | <0.1 |
Commercial D | 3000 | 72 | -- | 28 | <1 |
-- Pathway not included in derivation of HIL
* Value derived is based on consideration of the range of oral TRVs derived by JECFA (WHO 2011a) and EFSA (2010) and relevance of the key studies and derived ranges to the Australian population. The HILs are based on 70100% bioavailability—a more site specific bioavailability (such as 25%) may be considered where sufficiently justified.
APVMA 2005, The Reconsideration of Registrations of Arsenic Timber Treatment Products (CCA and Arsenic Trioxide) and their Associated Labels, Report of Review Findings and Regulatory Outcomes, Summary Report, Review Series 3, Australian Pesticides & Veterinary Medicines Authority, Canberra, Australia.
ATSDR 2007, Toxicological Profile for Arsenic, Agency for Toxic Substances and Disease Registry, US Department of Health and Human Services, Atlanta, USA.
Boyce, CP, Lewis, AS, Sax, SN, Eldan, M, Cohen, SM & Beck, BD 2008, ‘Probabilistic Analysis of Human Health Risks Associated with Background Concentrations of Inorganic Arsenic: Use of a Margin of Exposure Approach’, Human and Ecological Risk Assessment, vol. 14, pp. 11591201.
Brown, KG 2007, ‘How Credible are Cancer Risk Estimates from the S.W. Taiwan Database for Arsenic in Drinking Water’, Human and Ecological Risk Assessment, vol. 13, pp. 180190.
Chu, H-A & Crawford-Brown, DJ 2006, ‘Inorganic Arsenic in Drinking Water and Bladder Cancer: A Meta-Analysis for Dose-Response Assessment’, International Journal of Environmental Research and Public Health, vol. 3, no. 4, pp. 316322.
Clewell, HJ, Thomas, RS, Gentry, PR, Crump, KS, Kenyon, EM, El-Masri, HA & Yager, JW 2007, ‘Research toward the development of a biologically based dose response assessment for inorganic arsenic carcinogenicity: A progress report’, Toxicology and Applied Pharmacology, vol. 222, pp. 388398.
EA 2009a, Soil Guideline Values for inorganic arsenic in Soil, Science Report SC050021/ arsenic SGV, Environment Agency, Bristol, UK.
EA 2009b, Supplementary information for the derivation of SGV for arsenic, Science Report SC050021, Environment Agency, Bristol, UK.
EFSA 2010, Scientific Opinion on Arsenic in Food, EFSA Panel on Contaminants in the Food Chain (CONTAM), European Food Safety Authority, Parma, Italy.
Freeman, GB, Schoof, RA, Ruby, MV, Davis, AO, Dill, JA, Liao, SC, Lapin, CA, & Bergstrom, PD, 1995, ‘Bioavailability of arsenic in soil and house dust impacted by smelter activities following oral administration in cynomolgus monkeys’, Toxicological Sciences, vol. 28, pp. 215222.
FSANZ 2003, The 20th Australian Total Diet Survey. A total diet survey of pesticide residues and contaminants. Food Standards Australia and New Zealand.
FSANZ 2011, The 23rd Australian Total Diet Study, Food Standards Australia and New Zealand.
Health Canada 1993, Priority Substances List Assessment Report, Arsenic and its Compounds, Health Canada, 1993. Available from: http://www.hc-sc.gc.ca/ewh-semt/pubs/contaminants/psl1-lsp1/arsenic_comp/index-eng.php
IARC 2012, IARC Monographs on the Evaluation of Carcinogenic Risks to Humans, Volume 100. Part C: A Review of Human Carcinogens: Arsenic, Metals, Fibres, and Dusts, World Health Organization and International Agency for Research on Cancer. http://monographs.iarc.fr/ENG/Monographs/vol100C/mono100C-6.pdf.
Juhasz, A, Smith, E & Naidu, R 2003, Estimation of Human Bioavailability of Arsenic in Contaminated Soils, in Proceedings of the Fifth National Workshop on the Assessment of Site Contamination, Environmental Protection and Heritage Council.
Klein, CB, Leszczynska, J, Hickey, C & Rossman, TG 2007, ‘Further evidence against a direct genotoxic mode of action for arsenic-induced cancer’, Toxicology and Applied Pharmacology, vol. 222, pp. 289297.
Lamm, SH & Kruse, MB 2005, ‘Arsenic Ingestion and Bladder Cancer Mortality—What Do the DoseResponse Relationships Suggest About Mechanism?’, Human and Ecological Risk Assessment: An International Journal, vol. 11, no. 2, pp. 433450.
Langley, AJ 1991, Response Levels for Arsenic, in The Health Risk Assessment and Management of Contaminated Sites – Proceedings of a National Workshop on the Health Risk Assessment and Management of Contaminated Sites, El Saadi, O & Langley, A (Eds), South Australian Health Commission, Adelaide, Australia.
Lowney, YW, Wester, RC, Schoof, RA, Cushing, CA, Edwards, M & Ruby, M 2007, ‘Dermal absorption of arsenic from soils as measured in the rhesus monkey’, Toxicological Sciences, vol. 100, pp. 381392.
Merry, RH, Tiller, KG & Alston, AM 1986, ‘The effects of soil contamination with copper, lead and arsenic on the growth and composition of plants’, Plant and Soil, vol. 95, pp. 255269.
Ng, JC, Juhasz, AL, Smith, E & Naidu, R 2009, Contaminant bioavailability and bioaccessibility. Part 2: Guidance for industry, CRC CARE Technical Report no. 14, CRC for Contamination Assessment and Remediation of the Environment, Adelaide, Australia.
NHMRC 2004, Australian Drinking Water Guidelines, National Water Quality Management Strategy, Australia. National Health and Medical Research Council and the Agriculture and Resource Management Council of Australia and New Zealand.
NHMRC 2011, National water quality management strategy. Australian drinking water guidelines, National Health and Medical Research Council, Australia.
NRC 2001, Arsenic in Drinking Water: 2001 Update, National Research Council, National Academy Press.
MfE 2011, Toxicological Intake Values for Priority Contaminants in Soil, New Zealand Ministry for the Environment, Wellington, New Zealand, http://www.mfe.govt.nz/publications/hazardous/toxicological-intake-values-for-priority-contaminants-in-soil/index.html.
RIVM 2001, Re-evaluation of human-toxicological maximum permissible risk levels, National Institute of Public Health and the Environment, (RIVM), Bilthoven, Netherlands. Available from: http://www.rivm.nl/bibliotheek/rapporten/711701025.html
Roberts, SM, Weimer, WR, Vinson, JRT, Munson, JW & Bergeron, RJ 2002, ‘Measurement of arsenic bioavailability in soil using a primate model’, Toxicological Sciences, vol. 67, pp. 303310.
SAB 2005, Arsenic-Contaminated Soils, Questions and Discussion Materials, prepared for the Science Advisory Board, December 2005.
Sams, R II, Wolf, DC, Ramasamy, S, Ohanian, E, Chen, J & Lowit ,A 2007, ‘Workshop overview: Arsenic research and risk assessment’, Toxicology and Applied Pharmacology, vol. 222, pp. 245251.
Schoen, A, Beck, B, Sharma, R & Dube, E 2004, ‘Arsenic Toxicity at Low Doses: Epidemiological and Model of Action Considerations’, Toxicology and Applied Pharmacology, vol. 198, Issue 3, pp. 253267.
US EPA 2000, Guidance for Region 10 human health risk assessments regarding bioavailability of arsenic contaminated soil, United States Environmental Protection Agency, Washington, DC.
US EPA 2001, Inorganic Arsenic - Report of the Hazard Identification Assessment Review Committee, US EPA Health Effects Division, United States Environmental Protection Agency, Washington, DC. http://www.epa.gov/scipoly/sap/meetings/2001/october/inorganicarsenic.pdf
US EPA 2004, Risk assessment guidance for Superfund Vol. 1 Human Health Evaluation Manual (Part E, Supplemental guidance for dermal risk assessment), EPA/540/R-99/005. United States Environmental Protection Agency, Washington, DC.
US EPA 2005, Guidelines for Carcinogen Risk Assessment, Risk Assessment Forum, US EPA, EPA/630/P-03/001F, United States Environmental Protection Agency, Washington, DC.
US EPA 2009, Region 8 Recommendations for Quantifying the Bioavailability of Lead and Arsenic in Soil for Use in Human Health Risk Assessments, United States Environmental Protection Agency, Washington, DC. Online at: http://www.epa.gov/region8/r8risk/hh_rba.html#recs
US EPA 1998, Arsenic, inorganic (CASRN 7440-38-2), Integrated Risk Information System, United States Environmental Protection Agency, Washington, DC. Available from: http://www.epa.gov/iris/
Wester, RC, Maibach, HI, Bucks, DAW, Sedik, L, Melendres, J & Wade, M 1993, In vivo and in vitro percutaneous absorption and skin decontamination of arsenic from water and soil, Fundamental and Applied Toxicology, vol. 20, pp. 336–340.
WHO 1989, Arsenic, WHO Food Additives Series 24, Joint FAO/WHO Expert Committee on Food Additives, World Health Organization. Available from: http://www.inchem.org/documents/jecfa/jecmono/v024je08.htm.
WHO 2000, Air Quality Guidelines for Europe, 2nd Edn, World Health Organization, Geneva.
WHO 2001, Arsenic and arsenic compounds, Environmental Health Criteria 224, World Health Organization.
WHO 2011a, Evaluation of certain contaminants in food: seventy-second report of the Joint FAO/WHO Expert Committee on Food Additives, WHO technical report series, no. 959, World Health Organization, Geneva.
WHO 2011b, Guidelines for drinking-water quality, 4th edition, World Health Organization, Geneva, available from http://www.who.int/water_sanitation_health/dwq/chemicals/en/index.html.
Several comprehensive reviews of beryllium in the environment and its toxicity to humans are available and should be consulted for more detailed information (ATSDR 2002; WHO 1993; WHO 2001). The following provides a summary of the key aspects of beryllium that are relevant to the derivation of a soil HIL.
Beryllium is a steel grey, brittle metal that is not found as the free metal in nature. There are approximately 45 mineralised forms of beryllium. The most important beryllium minerals in the world are beryl (3BeOAl2O36SiO2) and bertrandite (Be4Si2O7(OH)2) (ATSDR 2002). Beryllium is the lightest of all solids and chemically stable substances, with an unusually high melting point, specific heat, heat of fusion, and strength-to-weight ratio. Due to its high affinity for oxygen, a very stable surface film of beryllium oxide (BeO) is formed on the surface of metallic beryllium and beryllium alloys, providing high resistance to corrosion, water and cold oxidising acids (WHO 1993).
Occupational exposure to beryllium has been associated with acute and chronic lung diseases. The acute disease is normally associated with inhalation exposures to high levels of soluble beryllium salts (e.g. sulphate, chloride) and BeO, and may lead to chronic disease. The chronic disease is associated with long-term inhalation exposures to dust particles containing beryllium, has an immunological component and a latent period, which varies depending on the beryllium species. Dermatological effects may also occur on skin contact (Di Marco & Buckett 1996).
The derivation of the previous HIL (HIL A = 20 mg/kg) for beryllium is presented by Di Marco & Buckett (1996). In summary, the HIL was derived on the basis of the following:
Ingestion of soil and dust is considered the most significant pathway of exposure for inorganics in soil. The consideration of bioavailability and inclusion of other exposure pathways in the derivation of a soil HIL has been further reviewed, as noted below.
While oral bioavailability has been considered in the previous HIL, insufficient data is available to adequately define the bioavailability of beryllium in the range of contaminated sites that may need to be considered in Australia. On this basis, a default approach of assuming 100% oral bioavailability has been adopted in the derivation of an HIL. It is noted that a site-specific assessment of bioavailability can be undertaken where required.
In humans and animals sensitised to beryllium, contact with beryllium and its soluble and insoluble compounds can cause dermatitis and skin granulomas. In general, the more soluble the compound the greater the sensitising potential. Dermal effects usually occur on abraded skin. Dermal absorption of beryllium is assumed to be poor and would not likely cause further systemic effects. While it is noted that absorption through damaged/injured skin is expected to be higher, review of dermal absorption of beryllium (Deubner et al. 2001) noted that absorption through intact skin is considered negligible (<<1%). Hence the assumption of 0.1% dermal absorption considered in the previous HIL is considered appropriate. The value is consistent with the default presented by RAIS (2010).
It is noted that US EPA (2004) has recommended the use of a gastrointestinal absorption factor (GAF) of 0.7%, based on consideration of the rat study (with water) used in the derivation of the oral RfD. The GAF is used to modify the oral toxicity reference value to a dermal value in accordance with the US EPA (2004) guidance provided.
Beryllium is not volatile and inhalation exposures associated with particulates outdoors and indoors are expected to be of less significance than ingestion of soil. While likely to be negligible, potential inhalation exposures associated with dust have been considered in the HIL derived.
Limited data is available on the potential for the uptake of beryllium into plants, in particular, edible fruit and vegetable crops. Review by ATSDR (2002) notes that in plants the uptake of beryllium appears to be restricted to the root system, with no significant translocation of beryllium to above-ground parts of the plant. Soluble forms of beryllium must be present for plant uptake to occur. In solution in the pH range of 68, beryllium is most commonly transformed to beryllium hydroxide, which has a very low solubility. Hence the potential for significant plant uptake is considered to be low.
Based on the above, the uptake of beryllium into root crops only has been considered in the derivation of the HIL. Limited plant uptake data is available, hence the value presented by RAIS (2010) of 0.0025 mg/kg fresh produce per mg/kg soil has been considered.
It is noted that the inclusion of home-grown produce in the calculations presented for HIL A results in some double counting of intakes from fruit and vegetable produce (also included in background intakes). To address this in the derivation of HIL A, half the intake estimated to be derived from home-grown produce is assumed to be already accounted for in the total background intake (noted below).
Limited data is available from Australia with respect to levels of beryllium in drinking water or food. ATSDR (2002) report concentrations of beryllium in Australian rainwater tanks between 0.05 and 0.08 µg/L. Beryllium is not routinely tested in drinking water supplies in Australia. Beryllium was not detected in any air sample collected in New South Wales (DEC 2003). Hence intakes that may be derived from ambient air are considered negligible.
The ATSDR (2002) and WHO (2001) reviews have not provided an update of potential background exposures from that considered in derivation of the current HIL (Di Marco & Buckett 1996). There is no data available to suggest that the background intakes considered in the derivation of the current HIL are an underestimate and hence these intakes are recommended to be retained in the derivation of revised HILs. For pre-schoolers a background intake of 0.65 µg/kg/day has been adopted, which constitutes approximately 30% of the recommended TRV.
IARC (2012) has classified beryllium and beryllium compounds as a Group 1 agent, which implies that it is considered carcinogenic to humans, though it is noted that the evidence of carcinogenicity applies to the inhalation route only.
Available data with respect to carcinogenicity was reviewed by WHO (2001). The review provided is no different from that summarised by Di Marco & Buckett (1996). Beryllium and compounds are considered carcinogenic to humans with the most important end point identified as lung cancer following inhalation exposures. WHO (2001) noted that the genotoxicity data for beryllium is mixed and it appears to be somewhat compound-dependent (NRC 2007). Although the bacterial assays have been largely negative, the mammalian test systems exposed to beryllium compounds have shown evidence of mutations, chromosomal aberrations, and cell transformations. ATSDR (2002) has considered beryllium compounds to be weakly genotoxic.
The mode of action for beryllium carcinogenicity is not well understood and the relevance of a non-threshold approach to the quantification of inhalation exposures is not clear. The following is noted by Di Marco & Buckett (1996) and is considered to remain relevant for the assessment of inhalation exposures:
‘Whilst lung cancer is the most important end point, it is unlikely to be a concern for beryllium in soil. Acute beryllium lung disease appears to occur prior to the development of lung cancer and may play a role in its induction. In addition, this disease has only been reported after exposure to high levels of specific beryllium compounds in the workplace; conditions which are unlikely to be achieved on exposures to dust generated from beryllium contaminated soil.’
This is supported by a more recent review by Hollins et al. (2009) where it was concluded that ‘the increase in potential risk of lung cancer was observed among those exposed to very high levels of beryllium and that beryllium’s carcinogenic potential in humans at exposure levels that exist in modern industrial settings should be considered either inadequate or marginally suggestive’.
Further review of carcinogenic risk associated with inhalation exposures in the current HIL by Di Marco & Buckett (1996) indicated that a soil concentration that is protective of carcinogenic risk via inhalation at a level of 1 in 100,000 (more than 1000 mg/kg) was well in excess of the derived HIL (20 mg/kg). This is consistent with calculations that would be conducted using current exposure assumptions.
On the basis of the above it is recommended that a threshold approach be adopted for the derivation of an HIL for beryllium in soil. The following are available from Level 1 Australian and International sources:
Source | Value | Basis/Comments |
Australian | ||
ADWG (NHMRC 2011) | TDI = 0.002 mg/kg/day | No quantitative evaluation is available in the previous ADWG (NHMRC 2004) due to lack of suitable oral data. TDI presented in ADWG (NHMRC 2011) and is derived from the WHO (2001) evaluation as noted below. |
International | ||
WHO (2001) | TDI = 0.002 mg/kg/day TC = 0.02 µg/m3 | TDI derived on the same basis as the RfD derived by the US EPA (noted below). TC based on the development of chronic beryllium disease in exposed workers, consistent with the study used by the US EPA (noted below). Note that beryllium is included in the rolling revisions to the DWG. The current guidelines (WHO 2011) adopt the same TDI as noted in the WHO (2001) review. |
ATSDR (2002) | Oral MRL = 0.002 mg/kg/day | Chronic oral MRL derived on the same basis as the US EPA (IRIS, 2010) evaluation below. |
US EPA (IRIS 2012) | RfD = 0.002 mg/kg/day RfC = 0.02 µg/m3 | RfD based on a BMD of 0.46 mg/kg/day associated with a 10% increase in inflammatory lesions in the small intestines of male and female dogs (1976 study) and a 300-fold uncertainty factor. RfC based on a LOAEL (HEC) of 0.0002 mg/kg/day associated with lung effects in a human study and a 10-fold uncertainty factor. |
The available international sources reference the same key studies and have derived the same toxicity reference values.
No dermal-specific studies or data are available. For the presence of beryllium in soil it is considered appropriate to consider use of the available TDI for all oral and dermal pathways of exposure (taking into account the relevant gastrointestinal absorption factor noted above).
On the basis of the discussion above, the following toxicity reference values (TRVs) have been adopted for beryllium in the derivation of HILs:

On the basis of the above, the following HILs have been derived for beryllium (refer to Appendix B for equations used to calculate the HILs and Appendix C for calculations):
HIL Scenario | HIL (mg/kg) | Percentage Contribution from Exposure Pathways | |||
Ingestion of Soil/Dust | Ingestion of Home-grown Produce | Dermal Absorption of Soil/Dust | Inhalation (dust) | ||
Residential A | 60 | 30 | 12 | 56 | 2 |
Residential B | 90 | 11 | -- | 86 | 3 |
Recreational C | 90 | 20 | -- | 79 | 1 |
Commercial D | 500 | 8 | -- | 88 | 4 |
-- Pathway not included in derivation of HIL
ATSDR 2002, Toxicological Profile for Beryllium, September 2002. Available from ATSDR website: http://www.atsdr.cdc.gov/toxfaqs/TF.asp?id=185&tid=33
DEC 2003, Ambient Air Quality Research Project (19962001), Internal working paper no. 4, Ambient concentrations of heavy metals in NSW, Department of Environment and Conservation (NSW).
Deubner, DC, Lowney, YW, Paustenbach, DJ & Warmerdam, J 2001, ‘Contribution of Incidental Exposure Pathways to Total Beryllium Exposures’, Applied Occupational and Environmental Hygiene, vol. 16(5), pp. 568–578.
Di Marco, PN & Buckett, KJ 1996, ‘Derivation of Health Investigation Levels for Beryllium and Beryllium Compounds’, presented in the proceedings of the Third National Workshop on the Health Risk Assessment and Management of Contaminated Sites, Contaminated Sites Monograph Series.
Hollins, DM, McKinley, MA, Williams, C, Fillos, D, Chapman, PS & Madi, AK 2009, ‘Beryllium and lung cancer: A weight of evidence evaluation of the toxicological and epidemiological literature’, Critical Reviews in Toxicology, vol. 39, No. s1, pp. 132.
IARC 2012, IARC Monographs on the Evaluation of Carcinogenic Risks to Humans, Volume 100. Part C: A Review of Human Carcinogens: Arsenic, Metals, Fibres, and Dusts, World Health Organization and International Agency for Research on Cancer. http://monographs.iarc.fr/ENG/Monographs/vol100C/mono100C-6.pdf.
NHMRC 2004 Australian Drinking Water Guidelines, National Water Quality Management Strategy. Australia: National Health and Medical Research Council and the Agriculture and Resource Management Council of Australia and New Zealand.
NRC 2007. Health Effects of Beryllium Exposure, A Literature Review, Committee on Beryllium Alloy Exposures, Committee on Toxicology, National Research Council of the National Academies.
RAIS 2010, Risk Assessment Information System, website and database maintained by the Oak Ridge Operations Office, available from: http://rais.ornl.gov/
US EPA (IRIS 2012). Data and information available from the Integrated Risk Information System, an online database, available from http://www.epa.gov/iris/.
US EPA 2004. Risk Assessment Guidance for Superfund, Volume I: Human Health Evaluation Manual (Part E, Supplemental Guidance for Dermal Risk Assessment), Final, EPA/540/R-99/005, OSWER 9285.7-02EP.
WHO 1993. Environmental Health Criteria 106 Beryllium International Programme of Chemical Safety, World Health Organization, Geneva.
WHO 2001. Beryllium and Beryllium Compounds, Concise International Chemicals Assessment Document 32, World Health Organization, Geneva.
WHO 2011, Guidelines for drinking-water quality, 4th edition, World Health Organization, Geneva, available from http://www.who.int/water_sanitation_health/dwq/chemicals/en/index.html.
Several comprehensive reviews of boron in the environment and its toxicity to humans are available and should be consulted for more detailed information not presented in this summary (ATSDR 2010; WHO 1998; US EPA 2004b). The following provides a summary of the key aspects of boron that are relevant to the derivation of a soil HIL.
Boron is never found in its elemental form in nature. The most common boron-containing ores are alkali and alkaline earth borates, including borax (Na4B4O2.10H2O), kernite (Na2B4O7.4H2O), colemanite (Ca2B6O11.5H2O), and ulexite (NaCaB5O9.8H2O), and borosilicate minerals. Common boron-containing compounds used in commerce also include borax pentahydrate, boric acid and boron oxide (ATSDR 2010).
Boron and boron compounds are used in the production of products such as fibreglass, soaps, detergents, enamels, frits, glazes, fertilisers, herbicides and fire retardants. They are also used in industries such as metallurgy, chemical synthesis and in nuclear applications (ATSDR 2010).
The toxicological database is largest for boric acid and borax and most of the toxicological information for inorganic borates in animals and humans is derived from studies on boric acid and borax (Mangas 1998).
Boron is an essential micronutrient for most plants and there is evidence that it is also essential for animals, including humans (ATSDR 2010).
The derivation of the previous HIL (HIL A = 3000 mg/kg) for boron is presented by Mangas (1998). In summary, the HIL was derived on the basis of the following:
Ingestion of soil and dust is considered the most significant pathway of exposure for inorganics in soil. The consideration of bioavailability and inclusion of other exposure pathways in the derivation of a soil HIL has been further reviewed as noted below.
While bioavailability (inhalation only) has been considered in the previous HIL, insufficient data is available to adequately define the bioavailability of boron. On this basis a default approach of assuming 100% oral (and inhalation) bioavailability has been adopted in the derivation of an HIL. It is noted that a site-specific assessment of bioavailability can be undertaken where required.
Dermal absorption of boron is considered to be low. While limited data is available, reviews by WHO (1998), ATSDR (2010) and US EPA (2004b) suggest the boron is not absorbed across intact skin. Review by MfE (2011) has also noted that dermal absorption is considered negligible and has not considered this pathway in the derivation of a soil guideline. It is noted that review of the derived HIL (based on 1% dermal absorption) contributes less than 5% of the HIL, and hence it is considered appropriate that, based on the available data, dermal absorption is not considered a significant pathway in the derivation of a soil HIL. This pathway has not been considered further.
Boron is not volatile and hence inhalation exposures associated with particulates outdoors and indoors are expected to be of less significance than ingestion of soil. While likely to be negligible, inhalation exposures have been considered in the HIL derived.
Review of plant uptake of boron by MfE (2011) has indicated that ‘it has not been possible to develop bioconcentration factors for boron. Reviewing the literature shows that boron uptake into plants is highly variable between species with no relationship with soil concentration or other soil parameters. Boron is an essential element for plant growth, but what may be optimal boron for one species may be toxic or insufficient for other species’. ‘Determining the significance of plant uptake of boron to human exposure is difficult, given the wide-ranging and overlapping concentrations that determine boron essentiality and toxicity in various species. Nonetheless, it appears that 300 mg/kg is a reasonable upper limit of non-toxic plant boron concentrations and thus can be used as the reasonable maximum amount of boron likely to be taken up in home-grown vegetables. Beyond that point vegetables are unlikely to be harvestable.’
The approach adopted by MfE (2011) in the derivation of a soil guideline for boron was to consider potential intakes associated with consumption of home-grown produce in soil concentrations that are not phytotoxic (300 mg/kg), as part of the overall intake from other sources. To obtain the additional background intake, a child’s produce consumption (0.048 kg DW[1]/day) was multiplied by 300 mg/kg and divided by the child body weight of 15.5 kg to obtain the maximum additional background daily intake for 100 % of produce being home-grown. For the consumption of 10% home-grown produce, this results in an additional intake of 0.09 mg/kg/day being considered.
It is noted that the inclusion of home-grown produce in the calculations presented for HIL A results in some double counting of intakes from fruit and vegetable produce (also included in background intakes). To address this in the derivation of HIL A, half the intake estimated to be derived from home-grown produce is assumed to be already accounted for in the total background intake (noted below). Hence background intakes that may be derived from all sources, including home-grown produce, are estimated to be 0.17 mg/kg/day.
No data is available on intakes of boron from sources other than soil in Australia. Hence the assessment of potential intakes from these sources has considered available international data.
Reviews of boron (WHO 1998 and ATSDR 2010) suggest that mean intakes of boron from the diet are approximately 1.2 mg/day for adults (and 0.85 mg/day for children), with intakes from consumer products approximately 0.1 mg/day (WHO 1998) and the contribution from air negligible. The total background intake presented by WHO (1998) is 1.9 mg/day. If this intake were assumed relevant for young children, it would comprise 0.13 mg/kg/day for young children. This is slightly higher than that estimated by MfE (2011), where intakes were estimated to be 0.08 mg/kg/day for young children (based on the same databut intakes from water were considered to be lower, based on the available water quality data from New Zealand). The higher value of 0.13 mg/kg/day has been adopted in the derivation of a soil HIL.
The International Agency for Research on Cancer (IARC) has not evaluated boron due to inadequate data.
Available studies on genotoxicity (US EPA 2004b and WHO 2009) were negative. This is consistent with the review presented by Mangas (1998). On the basis of the available information, it is recommended that a threshold approach be adopted for the derivation of an HIL for boron in soil. The following are available from Level 1 Australian and International sources:
Source | Value | Basis/Comments |
Australian | ||
ADWG (NHMRC 2011) | TDI = 0.16 mg/kg/day | The ADWG (NHMRC 2011) derived a guideline for boron in drinking water on the basis of a TDI of 0.16 mg/kg/day, based on a NOAEL from a developmental rat study (Price et al. 1996) and an uncertainty factor of 60. |
International | ||
WHO (1998) | TDI = 0.4 mg/kg/day | The WHO (1998) review derived a TDI of 0.4 mg/kg/day based on the same study considered in the ADWG (NHMRC 2011) and a different uncertainty factor of 25. |
WHO DWG (2009) | TDI = 0.17 mg/kg/day | TDI adopted is consistent with that adopted in the ADWG (NHMRC 2011) and is based on a benchmark dose (BMD) derived from relevant developmental studies of 10.3 mg/kg/day and uncertainty factor of 60. The principal study (noted to be similar to Price et al. 1996) and evaluation is consistent with that presented in the US EPA review (note the US EPA rounded the TDI in its evaluation). |
ATSDR (2010) | No evaluation available |
|
US EPA (IRIS 2012) | RfD = 0.2 mg/kg/day
| RfD (last reviewed in 2004) based on a BMD of 10.3 mg/kg/day associated with developmental effects in rats and an uncertainty factor of 66. |
The ADI currently considered in the ADWG (NHMRC 2011) and by US EPA (2004b) and WHO (2011) are essentially the same value (from studies that have resulted in consistent evaluations), namely 0.2 mg/kg/day. This threshold value is therefore recommended for derivation of the HIL.
No inhalation specific studies or data are available. For the presence of boron in soil it is considered appropriate to consider use of the available TDI for all pathways of exposure.
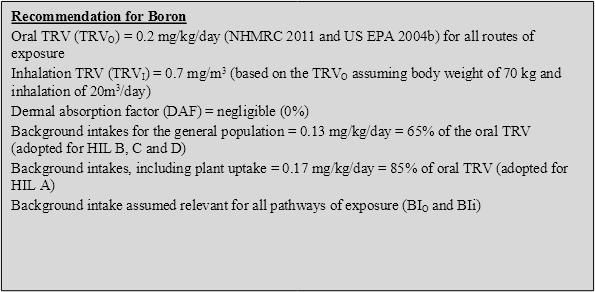
On the basis of the discussion above, the following toxicity reference values (TRVs) have been adopted for boron in the derivation of HILs:
On the basis of the above, the following HILs have been derived for boron (refer to Appendix B for equations used to calculate the HILs and Appendix C for calculations):
HIL Scenario | HIL (mg/kg) | Percentage Contribution from Exposure Pathways | |||
Ingestion of Soil/Dust | Ingestion of Home-grown Produce | Dermal Absorption of Soil/Dust | Inhalation (dust) | ||
Residential A | 4500 | 100 | Included in background | -- | <1 |
Residential B | 40 000 | 100 | -- | -- | <1 |
Recreational C | 20 000 | 100 | -- | -- | <1 |
Commercial D | 300 000 | 100 | -- | -- | <1 |
-- Pathway not included in derivation of HIL
ATSDR, 2010, Toxicological Profile for Boron, Agency for Toxic Substances and Disease Registry. Available from http://www.atsdr.cdc.gov/ToxProfiles/tp.asp?id=453&tid=80.
Mangas, S 1998, ‘Derivation of Health Investigation Levels for Boron and Boron Compounds’, presented in the proceedings of the Fourth National Workshop on the Health Risk Assessment and Management of Contaminated Sites, Contaminated Sites Monograph Series, No. 7.
MfE 2011, Toxicological intake values for priority contaminants in soil, New Zealand Ministry for the Environment, Wellington, New Zealand.
NHMRC 2011, National water quality management strategy. Australian drinking water guidelines, National Health and Medical Research Council, Australia.
Price, CJ, Strong, PL, Marr, MC, Myers, CB & Murray, FJ 1996, ‘Developmental toxicity NOAEL and postnatal recovery in rats fed boric acid during gestation’, Fundamental and Applied Toxicology, vol. 32(2), pp. 179193.
US EPA (IRIS 2012), Data and information available from the Integrated Risk Information System, an online database, available from http://www.epa.gov/iris/.
US EPA 2004a, Risk Assessment Guidance for Superfund, Volume I: Human Health Evaluation Manual (Part E, Supplemental Guidance for Dermal Risk Assessment), Final, EPA/540/R-99/005, OSWER 9285.7-02EP.
US EPA 2004b, Toxicological Review of Boron and Compounds, in support of summary information on the Integrated Risk Information System (IRIS).
WHO 1998, Environmental Health Criteria 204 Boron, World Health Organization, Geneva.
WHO 2009, Boron in Drinking Water, background document for development of WHO Guidelines for Drinking-water Quality, World Health Organization, Geneva.
WHO 2011, Guidelines for drinking-water quality, 4th edition, World Health Organization, Geneva. Available from http://www.who.int/water_sanitation_health/dwq/chemicals/en/index.html.
Several comprehensive reviews of cadmium in the environment and its toxicity to humans are available and should be consulted for more detailed information (ATSDR 2008; EA 2009a; WHO 2004). The following provides a summary of the key aspects of cadmium that are relevant to the derivation of a soil HIL.
Pure cadmium is a silver-white lustrous and malleable metal, is a solid at room temperature, is insoluble in water, and has a relatively low melting point and vapour pressure. The most common oxidation state of cadmium is 2+. Naturally occurring cadmium is commonly found in the Earth’s crust associated with zinc, lead and copper ores. Whereas pure cadmium and cadmium oxides are insoluble in water, some cadmium salts including cadmium chloride, cadmium nitrate, cadmium sulfate and cadmium sulfide are soluble in water (ATSDR 2008).
Cadmium is found naturally in mineral forms (primarily sulfide minerals) in association with zinc ores, zinc-bearing lead ores, and complex copper-lead-zinc ores. Due to its corrosion-resistant properties, a wide range of commercial and industrial applications have been developed involving cadmium-containing compounds and alloys that are used in a wide range of materials and products including batteries, pigments, metal coatings and platings, stabilisers for plastics, nonferrous alloys and solar cell devices (ATSDR 2008).
Cadmium is toxic to a wide range of organs and tissues, and a variety of toxicological end points (reproductive toxicity, neurotoxicity, carcinogenicity) have been observed in experimental animals and subsequently investigated in human populations (MfE 2011).
The derivation of the previous HIL (HIL A = 20 mg/kg) for cadmium is presented by Langley (1991). In summary, the HIL was derived on the basis of the following:
Ingestion of soil and dust is considered the most significant pathway of exposure for inorganics in soil. The consideration of bioavailability and inclusion of other exposure pathways in the derivation of a soil HIL has been further reviewed, as noted below.
While bioavailability (inhalation only) has been considered in the previous HIL, insufficient data is available to adequately define the bioavailability of cadmium. On this basis, a default approach of assuming 100% oral (and inhalation) bioavailability has been adopted in the derivation of an HIL. It is noted that a site-specific assessment of bioavailability can be undertaken where required.
Review of dermal absorption by MfE (2011) has noted the following: ‘The US EPA (2004) recommends a dermal absorption factor of 0.001 (0.1%) for cadmium, based on Wester et al. (1992). These authors determined the in vitro percutaneous absorption of cadmium as the chloride salt from soil and water, using human skin. Cadmium from soil penetrated the skin at 0.06% and 0.13% of the applied dose, with 0.01% and 0.07% respectively absorbed into the receptor fluid after 16 hours of exposure. Taking the geometric mean of the summed amounts bound to skin and that in the receptor fluid yields an average absorption factor of 0.0012 or 0.12%, similar to that recommended by the US EPA (2004). This low rate of absorption indicates that dermal exposure is a negligible route of exposure, and could be ignored in the derivation of soil guideline values for contaminated land in New Zealand, as has been done by other jurisdictions.’
On the basis of the above, dermal absorption has not been considered in the derivation of soil HILs.
Cadmium is not volatile and inhalation exposures associated with particulates outdoors and indoors are expected to be of less significance than ingestion of soil. While likely to be negligible, potential inhalation exposures associated with dust have been considered in the HIL derived.
In the review of cadmium presented by Langley (1991), a study by Tiller et al. (1976) was cited that involved evaluation of the uptake of cadmium into home-grown fruit and vegetables from soil in Port Pirie. The study showed concentrations of cadmium that were higher than those reported in produce samples from Adelaide shops. Hence cadmium uptake by edible fruit and vegetable crops is expected to be sufficiently significant to warrant inclusion in the derivation of soil HILs.
Further review of plant uptake of cadmium is presented by the EA (EA 2009b). This review considered studies that are based on the uptake of cadmium into green vegetables, root vegetables, tuber vegetables, herbaceous fruit, shrub fruit and tree fruit. The review provides recommendations on soil-to-plant uptake factors that are relevant for these types of produce. The recommendations from this review have been considered in the derivation of a residential A HIL and are summarised below for the range of crops considered:
Produce Group | Plant Uptake Factors (mg/kg produce fresh weight per mg/kg soil) (EA, 2009b) |
Green vegetables | 0.052 |
Root vegetables | 0.029 |
Tuber vegetables | 0.031 |
Tree fruit | 0.0014 |
It is noted that the inclusion of home-grown produce in the calculations presented for HIL A results in some double counting of intakes from fruit and vegetable produce (also included in background intakes). To address this in the derivation of HIL A, half the intake estimated to be derived from home-grown produce is assumed to be already accounted for in the total background intake (noted below).
Reviews of cadmium (WHO 2004) included food intakes provided by FSANZ (consistent with current data from FSANZ (2003)) of 0.1 µg/kg/day. Intakes for a young child aged 25 years from the 23rd Australian Food Survey (FSANZ 2011) ranged from a mean of 0.32 µg/kg/day to a 90th percentile of 0.44 µg/kg/day. While the WHO (2004) review notes that intakes of cadmium from food can exceed the adopted toxicity reference value, data from FSANZ (2011) does not suggest this is the case.
It is noted that the inclusion of home-grown produce in the calculations presented for HIL A results in some double counting of intakes from fruit and vegetable produce. The amount of double counting cannot be easily determined and hence intakes from food sources have not been further reduced to address this issue, though the use of the data from FSANZ is considered conservative for HIL A. Based on the available data from FSANZ (2011), intakes from food comprise up to 60% of the recommended oral TRV.
Cadmium was detected in air samples collected from urban and rural areas in NSW (DEC 2003). The average concentration reported was 0.17 ng/m3, ranging from 0.3 to 1 ng/m3. These concentrations constitute <520% of the recommended inhalation TRV in air (also considered as an international target in the DEC document). Background levels for cadmium in air can be conservatively assumed to comprise 20% of the recommended inhalation TRV.
IARC (2012) has classified cadmium and cadmium compounds as a Group 1 agent (i.e. carcinogenic to humans) based on additional evidence of carcinogenicity in humans and animals. It is noted that there is limited evidence of carcinogenicity in experimental animals following exposure to cadmium metal.
The following has been summarised from the review of cadmium presented by MfE (2011):
On the basis of the available information TRVs relevant for oral (and dermal) intakes and inhalation intakes have been considered separately.
Insufficient data is available to assess carcinogenicity via oral intakes and therefore the oral TRV has been based on a threshold approach with renal tubular dysfunction considered to be the most sensitive end point. The following are available for oral intakes from Level 1 Australian and International sources:
Source | Value | Basis/Comments |
Australian | ||
ADWG(NHMRC 2011) | TDI = 0.0007 mg/kg/day | The threshold oral value available from the ADWG (NHMRC 2011) of 0.0007 mg/kg/day is derived from a WHO/JECFA evaluation in 2000. The JECFA summary provided in 2004 noted that a PTWI of 0.007 mg/kg was established in 1988. This differs from that referenced (not cited) and considered in the ADWG. It is noted however that WHO may have rounded the TDI adapted as both values are similar. |
International | ||
JECFA (WHO 2010) | PTMI = 0.025 mg/kg (equivalent to PTDI = 0.0008 mg/kg/day) | Review of cadmium by JECFA in 2010 withdrew the previous PTWI (noted below). The review considered more recent epidemiological studies where cadmium-related biomarkers were reported in urine following environmental exposures. They identified that in view of the long half-life of cadmium in the body, dietary intakes should be assessed over months and tolerable intakes assessed over a period of at least a month. Hence the committee established a PTMI of 0.025 mg/kg. While established over a month, use of the value in the methodology adopted for establishing HILs requires a daily value. Exposures assessed in the HILs are chronic and hence, while used as a daily value, it relates to long-term exposures to cadmium. The former JECFA (WHO 2005) review provided a PTWI of 0.007 mg/kg for cadmium in reviews available from 1972 to 2005. This is equivalent to an oral PTDI of 0.001 mg/kg/day. This is based on a review by JECFA where renal tubular dysfunction was identified as the critical health outcome with regard to the toxicity of cadmium. The PTWI is derived on the basis of not allowing cadmium levels in the kidney to exceed 50 mg/kg following exposure over 4050 years. This PTDI is adopted by FSANZ (2003), the current WHO DWG (2011) and was used in the derivation of the current HIL (Langley 1991). |
WHO (2011) | PTMI = 0.025 mg/kg (equivalent to PTDI = 0.0008 mg/kg/day) | Based on JECFA review noted above |
RIVM (2001) | TDI = 0.0005 mg/kg/day | Value derived on the same basis as JECFA (WHO 2005), however RIVM has included an additional uncertainty factor of 2 to address potentially sensitive populations. |
ATSDR (2008) | Oral MRL = 0.0001 mg/kg/day | The MRL is based on the BMDL10 for low molecular weight proteinuria estimated from a meta-analysis of environmental exposure data (from ATSDR). |
US EPA (IRIS 2012) | RfD = 0.0005 mg/kg/day for intakes from water and RfD = 0.001 mg/kg/day for intakes from food | Cadmium was last reviewed by the US EPA in 1994. The RfD for intakes from water were derived on the same basis as considered by ATSDR. RfD were derived for intakes from food on the basis of a NOAEL of 0.01 mg/kg/day from chronic human studies and an uncertainty factor of 10. |
The available toxicity reference values or oral intakes are similar from the above sources with the PTMI established by JECFA (WHO 2010) providing the most current review of the available studies. This value has therefore been recommended for use as the oral TRV in the derivation of a soil HIL. This is consistent with that adopted in the ADWG (NHMRC 2011).
Inhalation of cadmium has been associated with carcinogenic effects (as well as others). Sufficient evidence is available (IARC 2012) to conclude that cadmium can produce lung cancers via inhalation. While cadmium is thought to be potentially genotoxic, the weight of evidence is not clear. In addition, epidemiology studies associated with lung cancer have confounding issues that limit useful interpretation (WHO 2000). It is noted that US EPA derived its inhalation unit risk on the basis of the same study that WHO dismissed due to confounding factors. In particular, a significant amount of the epidemiological data available also includes co-exposures with zinc and, in some cases, both zinc and lead.
With respect to the derivation of a soil HIL, cadmium is not volatile and hence inhalation exposures are only relevant to dust intakes. These are not likely to be significant for soil contamination and hence the consideration of carcinogenic effects (where the mode of action is not clear) using a non-threshold approach is not considered appropriate. It is appropriate to consider intakes on the basis of a threshold approach associated with the most significant end point. This is consistent with the approach noted by RIVM (2001) and considered by WHO (2000) and EA (2009a), where a threshold value for inhalation based on the protection of kidney toxicity (the most significant end point) has been considered. The value derived was then reviewed (based on the US cancer value) and considered to be adequately protective of lung cancer effects. On this basis WHO (2000) derived a guideline value of 0.005 µg/m3 and EA (2009a) derived an inhalation TDI of 0.0014 µg/kg/day (which can be converted to a guideline value of 0.005 µg/m3—the same as the WHO value).
On the basis of the discussion above, the following toxicity reference values (TRVs) have been adopted for cadmium in the derivation of HILs:

On the basis of the above (and using the assumptions presented in this document), an HIL A has been derived at 15 mg/kg, essentially the same (with consideration of uncertainties and accuracy of HIL calculations) as the existing HIL of 20 mg/kg. There is no new data available that suggests that the existing HIL is not adequately protective and therefore, given the level of uncertainty in the calculation of any HIL, the existing HIL A has been retained. HILs B, C and D have been calculated on the basis of the parameters presented above.
On the basis of the above, the following HILs have been derived for cadmium (refer to Appendix B for equations used to calculate the HILs and Appendix C for calculations):
HIL Scenario | HIL (mg/kg) | Percentage Contribution from Exposure Pathways | |||
Ingestion of Soil/Dust | Ingestion of Home-grown Produce | Dermal Absorption of Soil/Dust | Inhalation (dust) | ||
Residential A | 20 | 31 | 67% | -- | 2 |
Residential B | 150 | 78 | -- | -- | 22 |
Recreational C | 90 | 97 | -- | -- | 3 |
Commercial D | 900 | 65 | -- | -- | 35 |
-- Pathway not included in derivation of HIL
ATSDR 2008, Draft Toxicological Profile for Cadmium, Agency for Toxic Substances and Disease Registry, available from http://www.atsdr.cdc.gov/ToxProfiles/tp.asp?id=48&tid=15.
DEC 2003, Ambient Air Quality Research Project (19962001), Internal working paper no. 4, Ambient concentrations of heavy metals in NSW, Department of Environment and conservation (NSW).
EA 2009a, Soil Guideline Values for cadmium in soil, Science Report SC050021/Cadmium SGV, Environmental Agency, Bristol, UK.
EA 2009b. Supplementary information for the derivation of SGV for cadmium. Science Report SC050021/Technical review cadmium, Environmental Agency, Bristol, UK.
FSANZ 2003, The 20th Australian Total Diet Survey. A total diet survey of pesticide residues and contaminants, (website: http://www.anzfa.gov.au/).
FSANZ 2011, The 23rd Australian Total Diet Study, Food Standards Australia and New Zealand.
IARC 2012, IARC Monographs on the Evaluation of Carcinogenic Risks to Humans, Volume 100. Part C: A Review of Human Carcinogens: Cadmium and Cadmium Compounds, World Health Organization and International Agency for Research on Cancer. http://monographs.iarc.fr/ENG/Monographs/vol100C/mono100C-6.pdf.
Langley, AJ 1991, ‘Setting Investigation Levels for Cadmium’, presented in the proceedings of a National Workshop on the Health Risk Assessment and Management of Contaminated Sites, Contaminated Sites Monograph Series.
MfE 2011, Toxicological intake values for priority contaminants in soil, New Zealand Ministry for the Environment, Wellington, New Zealand.
NHMRC 2011, National water quality management strategy. Australian drinking water guidelines, National Health and Medical Research Council, Australia.
RIVM 2001, Re-evaluation of human-toxicological Maximum Permissible Risk levels, National Institute of Public Health and the Environment, Bilthoven, Netherlands. Available from: http://www.rivm.nl/bibliotheek/rapporten/711701025.html.
US EPA (IRIS 2012), Data and information available from the Integrated Risk Information System, an online database, available from http://www.epa.gov/iris/
US EPA 2004, Risk Assessment Guidance for Superfund, Volume I: Human Health Evaluation Manual (Part E, Supplemental Guidance for Dermal Risk Assessment), Final, EPA/540/R-99/005, OSWER 9285.7-02EP.
WHO 2000, Air Quality Guidelines for Europe, 2nd Edition. World Health Organization, Geneva.
WHO 2004, WHO Food Additives Series: 52, Cadmium (addendum). Available from: http://www.inchem.org/documents/jecfa/jecmono/v52je22.htm.
WHO 2005, Cadmium, Summary of Evaluations Performed by the Joint FAO.WHO Expert Committee on Food Additives (JECFA), Available from: http://www.inchem.org/documents/jecfa/jeceval/jec_297.htm.
WHO 2010, Joint FAO/WHO Expert Committee on Food Additives, Seventy-third meeting, Joint FAO.WHO Expert Committee on Food Additives (JECFA), Geneva, 8-17 June 2010, Summary and Conclusions.
WHO 2011, Guidelines for drinking-water quality, 4th edition, World Health Organization, Geneva, available from http://www.who.int/water_sanitation_health/dwq/chemicals/en/index.html.
Several comprehensive reviews of chromium VI (Cr VI) in the environment and its toxicity to humans are available and should be consulted for more detailed information not presented in this summary (ATSDR 1997 and 2008; DEFRA and EA 2002; APVMA 2005). The following provides a summary of the key aspects of Cr VI that are relevant to the derivation of a soil HIL.
Cr VI is less stable than the commonly occurring trivalent chromium but can be found naturally in the rare mineral crocoite. Cr VI typically exists as strongly oxidising species such as CrO3 and CrO42-. Some Cr VI compounds, such as chromic acid and the ammonium and alkali metal salts (e.g. sodium and potassium) of chromic acid are readily soluble in water. The Cr VI compounds are reduced to the trivalent form in the presence of oxidisable organic matter. However, in natural waters where there is a low concentration of reducing materials, Cr VI compounds are more stable (ATSDR 2008).
Chromium is of fundamental use in a wide range of industries, including the metallurgical (to produce stainless steels, alloy cast irons and nonferrous alloys), refractory (to produce linings used for high-temperature industrial furnaces) and chemical industries. In the chemical industry, Cr VI is used in pigments, metal finishing and in wood preservatives (ATSDR 2008).
The soil chemistry and toxicity of chromium is complex and hence the form of chromium in soil is of importance. In general, soil chromium is present as Cr III but the distribution of Cr III and Cr VI depends of factors such as Redox potential, pH, presence of oxidising or reducing compounds and formation of Cr complexes and salts.
Cr VI can readily pass through cell membranes and be absorbed by the body. Inside the body, Cr VI is rapidly reduced to Cr III. This reduction reaction can act as a detoxification process when it occurs at a distance from the target site for toxic or genotoxic effect. Similarly, if Cr VI is reduced to Cr III extracellularly, this form of the metal is not readily transported into cells and so toxicity is not observed (ATSDR 2008). However, if Cr VI is transported into cells, and close to the target site for toxic effect, under physiological conditions it can be reduced. This reduction reaction produces reactive intermediates, which can attack DNA, proteins, and membrane lipids, thereby disrupting cellular integrity and functions (ATSDR 2008).
The derivation of the previous HIL (HIL A = 100 mg/kg) for Cr VI is presented by Soong & Emmett (1993). In summary, the HIL was derived on the basis of the following:
Ingestion of soil and dust is considered the most significant pathway of exposure for inorganics in soil. The consideration of bioavailability and inclusion of other exposure pathways in the derivation of a soil HIL has been further reviewed, as noted below.
Bioavailability has not been considered in the previous HIL, as insufficient data is available. On this basis, a default approach of assuming 100% oral (and inhalation) bioavailability has been adopted in the derivation of an HIL. It is noted that a site-specific assessment of bioavailability can be undertaken where required.
Review of dermal exposure to chromium by MfE (2011) has indicated the following:
It is noted that based on the review presented by Soong & Emmett (1993), the HIL derived on the basis of oral intakes was shown to be adequately protective of allergic contact dermatitis. On the basis of this approach, dermal absorption has been considered negligible for Cr VI, consistent with the approach adopted by MfE (2011).
Cr VI is not volatile and inhalation exposures associated with particulates outdoors and indoors are expected to be of less significance than ingestion of soil. While likely to be negligible, potential inhalation exposures associated with dust have been considered in the HIL derived.
Review of plant uptake by MfE (2011) has noted that concentrations of chromium in a form that can be taken up by plants is extremely low in most soils, consistent with the available data., The approach adopted by MfE (2011) has been to adopt an arithmetic average of plant uptake values available from available reviews that relate to Cr VI and Cr in general (0.0324 mg/kg fresh produce per mg/kg soil). There is limited data available on concentrations of Cr VI in edible fruit and vegetable crops and uptake is expected to be limited. In addition ATSDR (2008) has noted that translocation of chromium within plants is poor. Hence the plant uptake value recommended by MfE (2011) has been considered for root and tuber crops only.
It is noted that the inclusion of home-grown produce in the calculations presented for HIL A results in some double counting of intakes from fruit and vegetable produce (also included in background intakes). To address this in the derivation of HIL A, half the intake estimated to be derived from home-grown produce is assumed to be already accounted for in the total background intake (noted below).
Intakes of total chromium were addressed in the FSANZ 22nd Australian Total Diet Survey (2008). Estimated dietary intakes of chromium (total) for infants and 23-year-olds ranged from 1426 µg/day, and for adults ranged from 1453 µg/day for males 1930 years. The average values reported are consistent with intakes reported from Germany and USA by APVMA (2005). Dietary intakes of total chromium may comprise a significant portion of the TDI for Cr VI. However it is noted that the most common form of chromium in fresh produce is Cr III. If Cr VI comprised 10% of the total Cr intake from the diet (based on data from bread analyses, Soares et al. 2010) then background intakes may comprise 0.090.17 µg/kg/day for young children aged 23 years. It is considered reasonable that an average intake be adopted given additional intakes from plant uptake are included in addition to these intakes, resulting in some doubling up of intakes from food sources. The average intake of Cr VI is estimated to be 0.13 µg/kg/day for 23 year olds, approximately 10% of the recommended oral TRV.
No data on Cr VI in air is available for Australia. Intakes of Cr VI from air may comprise up to 30% of total chromium (RIVM 2001), which has been reported up to 1.5 ng/m3 (RIVM 2001) to 3 ng/m3 (DEFRA & EA 2002). It is noted that concentrations of Cr VI in Europe and the UK are expected to be higher than in Australia due to the potential for long-range atmospheric transport from a greater proportion of industry in these general regions. Based on the recommended TRV for particulate-phase Cr VI, these conservative air concentrations comprise less than 1% of the TC and are assumed negligible.
IARC (2012) has classified Cr VI compounds as Group 1 carcinogens—carcinogenic to humans based on: sufficient evidence in humans for the carcinogenicity of Cr VI compounds as encountered in the chromate production, chromate pigment production and chromium plating industries.
Chromium is classified by the US EPA as a Group A (known human carcinogen by the inhalation route), with carcinogenicity by the oral route of exposure noted to be Group D (not classified).
Oral and inhalation exposures have been reviewed separately as follows.
There is limited data available regarding the carcinogenic potential of ingested Cr VI. Cr VI compounds appear to be genotoxic and some reviews (RIVM 2001) suggest that a non-threshold approach is relevant to all routes of exposure. Some drinking water studies (NTP 2008) are available that show a statistically significant increase in tumours in rats and mice. However, there is currently no peer-reviewed data available to determine a quantitative non-threshold value for ingestion of Cr VI compounds (note a draft value has been recently published by OEHHA 2009). There is also some suggestion (De Flora et al. 1997; Jones 1990) that there may be a threshold for the carcinogenicity of Cr VI based on the hypothesis that it is a high-dose phenomenon, where the dose must exceed the extracellular capacity to reduce Cr VI to Cr III.
The following are available for oral intakes from Level 1 Australian and International sources:
Source | Value | Basis/Comments |
Australian | ||
ADWG (NHMRC 2011) | No evaluation available | The ADWG (NHMRC 2011) does not specifically derive a guideline; however it references the WHO DWG assessment, where the basis for derivation is not clear. No quantitative toxicity values can be obtained from these sources. |
International | ||
WHO (2011) | No evaluation available | Current guideline based on limit of detection as no adequate toxicity studies were available to provide the basis for a NOAEL. It is noted that chromium is included in the plan of work of rolling revisions to the DWG WHO (2011). |
DEFRA & EA (2002) | TDI = 0.003 mg/kg/day | Adopted oral RfD from the US EPA. |
RIVM (2001) | TDI = 0.005 mg/kg/day | RIVM has adopted a provisional threshold TDI of 0.005 mg/kg/day based on a 1-year drinking water study in rats as used in the derivation of the former and current US EPA RfD (with a small difference in the application of uncertainty factors). |
ATSDR (2008) | MRL = 0.001 mg/kg/day | The chronic oral MRL is based on a BMDL10 of 0.09 mg/kg/day for non-neoplastic lesions of the duodenum in a 2-year drinking water study in rats and mice (NTP 2008) and an uncertainty factor of 90. The study considered by ATSDR was not available when the other organisations (US EPA, etc.) reviewed Cr VI. |
US EPA (IRIS 2012) | RfD = 0.003 mg/kg/day | The US EPA (available on IRIS, but last reviewed in 1998) derived an oral RfD of 0.003 mg/kg/day based on a NOAEL of 2.5 mg/kg/day from a 1-year drinking water study in rats and an uncertainty factor of 300 and modifying factor of 3 to address uncertainties in the study. The confidence level in the study, database and RfD is noted to be low. |
It is recommended that the lower value derived by ATSDR (2008) be adopted for the assessment of oral exposures to Cr VI, as the assessment provides the most current comprehensive assessment of the available studies, including a more recent key study (NTP 2008) not available at the time of review by other organisations. The values adopted by RIVM and the UK are essentially the same, using the study considered by the US EPA (McKenzie et al. 1958) in the derivation of the RfD. It is noted that review by Health Canada (2004) considered the study used by US EPA was of poor quality, though it was used due to the lack of additional, better quality data.
Epidemiological studies have shown an association between exposure to Cr VI and lung cancer. These studies have involved chromate production, chromate pigment production and use, chromium plating, stainless steel welding, ferrochromium alloy production and leather tanning. Various Cr VI compounds have also been shown to be carcinogenic via inhalation in experimental animals. Cr VI has also been shown to be genotoxic. As noted by DEFRA & EA (2002), there is some suggestion that chromium-induced cancer of the respiratory tract may be exclusively a high-dose phenomenon with a threshold relevant to low-dose exposures but quantitative data is lacking.
With respect to the derivation of a soil HIL, chromium is not volatile and hence inhalation exposures are only relevant to dust intakes. These are not likely to be significant for soil contamination and hence the consideration of carcinogenic effects using a non-threshold approach may not be appropriate. It is appropriate to consider intakes on the basis of a threshold approach associated with the most significant end-point. In addition inhalation exposures relating to soil contamination (dust) are expected to differ from the occupation studies from which the non-threshold criteria are derived (where inhalation of fine dust and chromic acid mists occurs). These issues were considered by ITER (1998) in the derivation of an RfC that is relevant for environmental exposures only, not to occupational exposures associated with mists and aerosols, and US EPA (IRIS 2012 and as outlined in US EPA 1998) in the derivation of an RfC.
The following are available for inhalation exposures for Cr VI particulates or dust from Level 1 Australian and International sources:
In addition the following are also available:
On the basis of the discussion above, the following toxicity reference values (TRVs) have been adopted for Cr VI in the derivation of HILs:
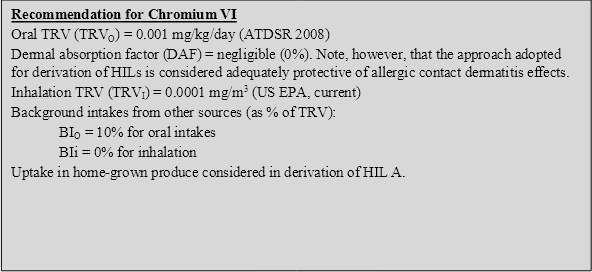
On the basis of the above (and using the assumptions presented in this document) an HIL A has been derived at 80 mg/kg, essentially the same (with consideration of uncertainties and accuracy of HIL calculations) as the existing HIL of 100 mg/kg. There is no new data available that suggests that the existing HIL is not adequately protective and therefore, given the level of uncertainty in the calculation of any HIL (including consideration of other oral TRVs available that are less conservative than the TRV adopted), the existing HIL A has been retained. HILs B, C and D have been calculated on the basis of the parameters referenced above.
On the basis of the above, the following HILs have been derived for Cr VI (refer to Appendix B for equations used to calculate the HILs and Appendix C for calculations):
HIL Scenario | HIL (mg/kg) | Percentage Contribution from Exposure Pathways | |||
Ingestion of Soil/Dust | Ingestion of Home-grown Produce | Dermal Absorption of Soil/Dust | Inhalation (dust) | ||
Residential A | 100 | 58 | 41 | -- | 1 |
Residential B | 500 | 97 | -- | -- | 3 |
Recreational C | 300 | 99 | -- | -- | 1 |
Commercial D | 3600 | 94 | -- | -- | 6 |
-- Pathway not included in derivation of HIL
ATSDR 1997, Toxicological Profile for Chromium, Agency for Toxic Substances and Disease Registry.
ATSDR 2008, Draft Toxicological Profile for Chromium, Agency for Toxic Substances and Disease Registry. Available from http://www.atsdr.cdc.gov/ToxProfiles/tp.asp?id=62&tid=17.
APVMA 2005, The Reconsideration of Registrations of Arsenic Timber Treatment Products (CCA and Arsenic Trioxide) and their Associated Labels, Report of Review Findings and Regulatory Outcomes, Summary Report, Review Series 3, Australian Pesticides &Veterinary Medicines Authority, Canberra, Australia.
Baars, AJ, Theelan, RMC, Janssen, PJCM, Hesse, JM, van Apeldoorn, ME, Meijerink, MCM, Verdam, L, Zeilmaker, MJ 2001, Re-evaluation of Human Toxicological Maximum Permissible Risk Levels, RIVM report 711701025, National Institute for Public Health and the Environment (RIVM), Bilthoven, Netherlands.
De Flora, S, Camoirana, A, Bagnasco, M et al. 1997, ‘Estimates of the chromium(VI) reducing capacity in human body compartments as a mechanism for attenuating its potential toxicity and carcinogenicity’, Carcinogenesis, vol. 18(3), pp. 531537.
DEFRA & EA 2002, Contaminants in Soil: Collation of Toxicological and Intake Data for Humans: Chromium, Department for Environment, Food and Rural Affairs and the Environment Agency, Bristol, UK.
FSANZ 2008, The 22nd Australian Total Diet Study, Food Standards Australia and New Zealand.
Guy, RH, Hostynek, JJ, Hinz, RS & Lorence, CR 1999, Metals and the Skin: Topical Effects and Systemic Absorption, Marcel Dekker, New York, USA.
Health Canada 2004, Contaminated Sites Program, Federal Contaminated Site Risk Assessment in Canada, Part I: Guidance of Human Health Preliminary Quantitative Risk Assessment (PQRA), September 2004.
IARC 2012, IARC Monographs on the Evaluation of Carcinogenic Risks to Humans, Volume 100. Part C: A Review of Human Carcinogens: Arsenic, Metals, Fibres, and Dusts, World Health Organization and International Agency for Research on Cancer. http://monographs.iarc.fr/ENG/Monographs/vol100C/mono100C-6.pdf.
ITER 1998, ITER Peer Review on Hexavalent Chromium Meeting Summary, April 16, 1998, available from http://www.tera.org/peer/HexavalentChromium.html.
Jones, RE 1990, ‘Hexavalent chrome: threshold concept for carcinogenicity’, Biomed Environm Sci, vol. 3, pp. 2034.
McKenzie, RD, Byerrum, RU, Decker, CF, Hoppert, CA, Langham, RF 1958, ‘Chronic toxicity studies: Hexavalent and trivalent chromium administered by drinking water to rats’, American Medical Association Archives of Industrial Health vol. 18, pp. 232–234.
MfE 2011, Toxicological intake values for priority contaminants in soil, New Zealand Ministry for the Environment, Wellington, New Zealand.
NHMRC 2011, National water quality management strategy. Australian drinking water guidelines, National Health and Medical Research Council, Australia.
NTP 2008, NTP technical report on the toxicology and carcinogenesis studies of sodium dichromate dihydrate (CAS No. 7789-12-0) in F344/N rats and B6C3F1 mice (drinking water studies),: National Toxicology Program, Washington, DC, NTP TR 546. http://ntp.niehs.nih.gov/files/546_web_FINAL.pdf.
OEHHA 2009, Draft Public Health Goal for Hexavalent Chromium in Drinking Water, prepared by Pesticide and Environmental Toxicology Branch, Office of Environmental Health Hazard Assessment (OEHHA), California Environmental Protection Agency, August 2009.
RIVM 2001, Re-evaluation of human-toxicological Maximum Permissible Risk levels, National Institute of Public Health and the Environment, Bilthoven, Netherlands. Available from: http://www.rivm.nl/bibliotheek/rapporten/711701025.html.
Soares, ME, Vieira, E & de Lourdes Bastos, M 2010, ‘Chromium Speciation Analysis in Bread Samples’, J Agric Food Chem, vol. 58(2), pp. 13661370.
Soong, FS & Emmett, AJ 1993, ‘Assessment and Management of CCA Timber Preservation Plants’, presented in the proceedings of the Second National Workshop on the Health Risk Assessment and Management of Contaminated Sites, Contaminated Sites Monograph Series, No. 2.
US EPA (IRIS 2012), Data and information available from the Integrated Risk Information System, an online database, available from http://www.epa.gov/iris/.
US EPA 1998, Toxicological Review of Hexavalent Chromium, in support of Summary Information on the Integrated Risk Information System (IRIS).
WHO 2000, Air Quality Guidelines for Europe, 2nd edn, WHO Regional Publications, European Series No. 91, World Health Organization, Copenhagen.
WHO 2011, Guidelines for drinking-water quality, 4th edition, World Health Organization, Geneva, available from http://www.who.int/water_sanitation_health/dwq/chemicals/en/index.html.
Several comprehensive reviews of cobalt in the environment and its toxicity to humans are available and should be consulted for more detailed information (ATSDR 2004; WHO 2006). The following provides a summary of the key aspects of cobalt that are relevant to the derivation of a soil HIL.
Cobalt (Co) is a silvery grey solid at room temperature. Naturally occurring cobalt is most commonly found in association with nickel, silver, lead, copper, and iron ores. Common cobalt minerals include linnaeite (Co3S4), carrolite (CuCo2S4), safflorite (CoAs2), skutterudite (CoAs3) and glaucodot (CoAsS). In the natural environment, cobalt may be found in two oxidation states, Co2+ and Co3+, dependent upon Redox potential and pH of the environment (WHO 2006).
Cobalt comprises approximately 0.0025% of the weight of the Earth’s crust, making it the 33rd most abundant element. Cobalt is a key constituent in several alloys including alnico, an alloy with powerful permanent magnetic properties that is used for high-speed, heavy-duty, high-temperature cutting tools. Cobalt has also been used as a colourant in glass, ceramics, and paints, is of catalytic use to the petrochemical and plastic industries, and is applied to soils as a fertiliser to increase plant yields or to increase the cobalt concentration in forage crops and prevent the symptoms of cobalt deficiency in livestock (ATSDR 2004; WHO 2006).
Cobalt is a dietary essential element as it is a key component of Vitamin B12 (ATSDR 2004). As such, adverse effects can occur as a result of deficiency as well as contamination. Without sufficient levels of dietary cobalt, red blood cell production may be severely inhibited, leading to anaemia, heart disease, reduced growth and the breakdown of both the nervous and the immune systems in humans (IARC 1991). Excess amounts of cobalt may also have harmful effects in humans. Inhaled cobalt primarily targets the respiratory tract. From the respiratory tract, cobalt particles may be absorbed into the blood via dissolution or transported to the gastrointestinal tract with mucous when swallowing. Gastrointestinal cobalt absorption rates are reported to vary greatly in humans, with some studies associating iron deficiencies with increased cobalt absorption rates (ATSDR 2004). Cobalt in the body partakes in reactions that generate oxidants and free radicals capable of deoxyribonucleic acid (DNA) damage and other deleterious effects (ATSDR 2004).
The derivation of the previous HIL (HIL A = 100 mg/kg) for cobalt is presented by Buckett & Di Marco (1998). In summary, the HIL was derived on the basis of the following:
Ingestion of soil and dust is considered the most significant pathway of exposure for inorganics in soil. The consideration of bioavailability and inclusion of other exposure pathways in the derivation of a soil HIL has been further reviewed, as noted below.
According to ATSDR (2004), the oral bioavailability of cobalt varies from 1897% depending on dose, form of cobalt compound and nutritional status of the subjects.
While bioavailability has been considered in the previous HIL, insufficient data is available to adequately define the bioavailability of cobalt from soil. On this basis, a default approach of assuming 100% oral (and inhalation) bioavailability has been adopted in the derivation of an HIL. It is noted that a site-specific assessment of bioavailability can be undertaken where required.
In humans, inhalation and dermal exposure have been observed to result in sensitisation to cobalt (WHO 2006), hence it is reasonable to consider that dermal absorption may be more than negligible. Limited data is available regarding the dermal absorption of cobalt from soil and hence a default value of 0.1% has been considered. The default value of 0.1% is the lower end of the range considered relevant for metals as presented by US EPA (1995), which is higher than the dermally absorbed fraction of 0.0004 cited by Paustenbach (2000) for cobalt chloride (0.04%) in aqueous solution.
Cobalt is not volatile and hence inhalation exposures associated with particulates outdoors and indoors are expected to be of less significance than ingestion of soil. While likely to be negligible, inhalation exposures have been considered in the HIL derived.
In the review of cobalt presented by Buckett & Di Marco (1998), it was noted that, based on data presented by IARC (1991), cobalt can be detected in plants. Whether cobalt is essential to plant growth has not been well established, however it appears that plant uptake may be somewhat significant and, as such, has been included in the derivation of HIL A. Review by WHO (2006) notes that, although plants may take up cobalt from the soil, the translocation of cobalt from the roots to other parts of the plant is not significant.
Based on the above, the uptake of cobalt into all crops has been considered in the derivation of the HIL A. Limited plant uptake data is available, and translocation into above ground crops is assumed to be negligible, hence the value presented by RAIS (2010) of 0.023 mg/kg fresh produce per mg/kg soil has been considered for root and tuber crops only.
It is noted that the inclusion of home-grown produce in the calculations presented for HIL A results in some double counting of intakes from fruit and vegetable produce (also included in background intakes). To address this in the derivation of HIL A, half the intake estimated to be derived from home-grown produce is assumed to be already accounted for in the total background intake (noted below).
The most significant source of intake of cobalt from sources other than contamination is dietary intake (WHO 2006). Cobalt intakes were considered in the 23rd Australian Total Diet Study (FSANZ 2011), where intakes for a child aged 23 years ranged from a mean of 1 µg/kg/day to a 90th percentile of 1.3 µg/kg/day. RIVM (2001) reviewed background intakes of cobalt, which were considered to be 0.3 µg/kg/day, consistent with intakes from food noted by WHO (2006, where a body weight of 70 kg was assumed). These intakes are between 20% and 70% of the recommended oral TRV. Given the lack of data in support of oral TRVs for cobalt, the only available value from RIVM has been adopted, the lower value of 20% in the derivation of soil HILs.
Cobalt was reported in ambient air data collected in NSW (DEC 2003) where concentrations in urban, regional and industrial areas assessed ranged from 0.10.39 ng/m3. Intakes associated with these concentrations are negligible compared with intakes from food and the recommended inhalation TRV.
The International Agency for Research on Cancer (IARC 1991) has classified cobalt metal, cobalt sulphate and other soluble cobalt (II) salts as Group 2B—possible human carcinogen. IARC provided further review in 2006 classifying cobalt sulphate and other soluble cobalt (II) salts as Group 2B, cobalt metal without tungsten carbide as Group 2B and cobalt metal with tungsten carbide as Group 2A (probable human carcinogen).
It is noted that US EPA has not evaluated cobalt with respect to classification of carcinogenicity.
While data is limited, based on the weight of evidence cobalt is not (or is weakly) genotoxic (RIVM 2001: ATSDR 2004). However it is noted that some information suggests that some metallic cobalt species may be genotoxic, and this may need to be considered in occupational environments. On this basis, it is recommended that a threshold approach be adopted for the derivation of an HIL for cobalt in soil.
Few quantitative evaluations are available for cobalt, however the following are available from Level 1 Australian and International sources:
Source | Value | Basis/Comments |
Australian | ||
ADWG (NHMRC 2011) | No evaluation available |
|
International | ||
WHO (2011) | No evaluation available |
|
WHO (2006) | TC = 0.0001 mg/m3 | WHO (2006) derived a TC in air of 0.0001 mg/m3 based on a NOAEC from an occupational inhalation study with conversions to address exposures by the general population. WHO did not derive an oral threshold value, due to the lack of suitable data. |
RIVM (2001) | TDI = 0.0014 mg/kg/day TC = 0.0005 mg/m3 | RIVM (2001) derived a TDI of 0.0014 mg/kg/day based on a LOAEL of 0.04 mg/kg/day associated with cardiomyopathy from oral exposures in workers and an uncertainty factor of 30. The TC is based on a LOAEC of 0.005 mg/m3 for interstitial lung disease in workers and an uncertainty factor of 100. |
ATSDR (2004) | Inhalation MRL = 0.0001 mg/m3 | Chronic inhalation MRL of 0.0001 mg/m3 based on a NOAEL of 0.0013 mg/m3 (adjusted) for decreased respiratory function in workers and an uncertainty factor of 10. No chronic oral MRL is available from ATSDR (2004). |
US EPA (IRIS 2012) | No evaluation available |
|
Note that the current HIL for cobalt was established on the basis of a derived PTDI that ranged from 15 µg/kg/day.
Only one oral value is available from RIVM (2001), which is recommended to be adopted for the derivation of a soil HIL. The available inhalation values are fairly consistent with the most recent detailed evaluations provided by WHO and ATSDR, which are recommended.
On the basis of the discussion above, the following toxicity reference values (TRVs) have been adopted for cobalt in the derivation of HILs:
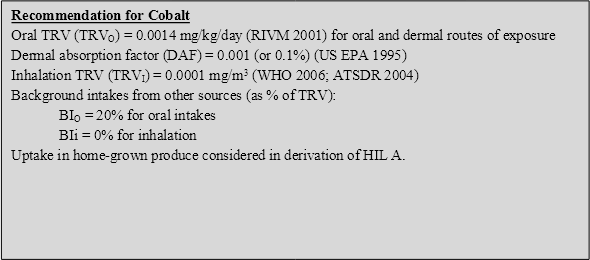
On the basis of the above, the following HILs have been derived for cobalt (refer to Appendix B for equations used to calculate the HILs and Appendix C for calculations):
HIL Scenario | HIL (mg/kg) | Percentage Contribution from Exposure Pathways | |||
Ingestion of Soil/Dust | Ingestion of Home-grown Produce | Dermal Absorption of Soil/Dust | Inhalation (dust) | ||
Residential A | 100 | 65 | 33 | 1 | 1 |
Residential B | 600 | 91 | -- | 5 | 4 |
Recreational C | 300 | 97 | -- | 3 | <1 |
Commercial D | 4000 | 87 | -- | 7 | 6 |
-- Pathway not included in derivation of HIL
ATSDR 2004, Toxicological Profile for Cobalt, Agency for Toxic Substances and Disease Registry, available from: http://www.atsdr.cdc.gov/ToxProfiles/tp.asp?id=373&tid=64.
Buckett, KJ & Di Marco, PN 1998, ‘Derivation of Health Investigation Levels for Cobalt and Cobalt Compounds’, presented in the proceedings of the Fourth National Workshop on the Health Risk Assessment and Management of Contaminated Sites, Contaminated Sites Monograph Series, No. 7.
DEC 2003, Ambient Air Quality Research Project (1996-2001), Internal working paper no. 4, Ambient concentrations of heavy metals in NSW, Department of Environment and conservation (NSW).
FSANZ 2011, The 23rd Australian Total Diet Study, Food Standards Australia and New Zealand.
IARC1991, IARC Monographs on the Evaluation of Carcinogenic Risks to Humans: Metallic Cobalt Compounds (With or Without Tungsten Carbide), International Agency for Research on Cancer , World Health Organization, Lyons, France.
NHMRC 2011, National water quality management strategy. Australian drinking water guidelines, National Health and Medical Research Council, Australia.
Paustenbach, DJ 2000, ‘The practice of exposure assessment: A state-of-the-art review’, J.Toxicol.Environ. Health. Part B, vol. 3,pp. 179291.
RAIS 2010, Risk Assessment Information System, website and database maintained by the Oak Ridge Operations Office, available from: http://rais.ornl.gov/.
RIVM 2001, Re-evaluation of human-toxicological Maximum Permissible Risk levels, National Institute of Public Health and the Environment, Bilthoven, Netherlands,. available from: http://www.rivm.nl/bibliotheek/rapporten/711701025.html.
US EPA 1995, Technical Guidance Manual, Assessing Dermal Exposure from Soil., US EPA Region 3, December 1995, available from: http://www.epa.gov/reg3hwmd/risk/human/info/solabsg2.htm.
US EPA (IRIS 2012), Data and information available from the Integrated Risk Information System, an online database, available from http://www.epa.gov/iris/
WHO 2006, Cobalt and Inorganic Cobalt Compounds. Concise International Chemical Assessment Document 69, available from: http://www.inchem.org/documents/cicads/cicads/cicad69.htm.
Several comprehensive reviews of copper in the environment and its toxicity to humans are available and should be consulted for more detailed information (ATSDR 2004; WHO 1998; NEHF 1997). The following provides a summary of the key aspects of copper that are relevant to the derivation of a soil HIL.
Copper (Cu) can occur naturally in its elemental form. Copper may also occur in the environment in various mineral forms including cuprite (Cu2O), malachite (CuCO3·Cu(OH)2), azurite (2CuCO3·Cu(OH)2), chalcopyrite (CuFeS2), chalcocite (Cu2S), and bornite (Cu5FeS4). Metallic copper is a malleable and ductile solid that has strong electrical and thermal conducting properties and low corrosiveness. Copper is a transition metal and may occur as either the monovalent or divalent cation. Copper may exist in four oxidation states Cu(0), Cu(I), Cu(II) and Cu(III) (ATSDR 2004; WHO 1998).
Copper is a naturally occurring trace element of significant societal importance. It is not only an essential nutrient in virtually all forms of life, it is also an important constituent in numerous consumer and industrial materials, both as the free metal and as a component in metal alloys. Common copper metal alloys include brass, bronze and gun metal. Copper and copper alloys are used in plumbing, telecommunications, power utilities, air conditioning, automotives, business electronics and industrial valves. Copper sulfate and other copper compounds are important constituents in products having agricultural (namely fungicides) and other applications, including metal finishing, wood preservatives and water treatment (ATSDR 2004).
Copper is an essential element and, as such, adverse effects may occur as a result of deficiency as well as excess intakes resulting from contamination.
The derivation of the previous HIL (HIL A = 1000 mg/kg) for copper is presented by Soong & Emmett (1993) and as summarised in NEPC (1999). In summary, the HIL was derived on the basis of the following:
Ingestion of soil and dust is considered the most significant pathway of exposure for inorganics in soil. The consideration of bioavailability and inclusion of other exposure pathways in the derivation of a soil HIL has been further reviewed as noted below:
Bioavailability has not been considered in the previous HIL, as insufficient data is available to adequately define the bioavailability of copper from soil. On this basis, a default approach of assuming 100% oral (and inhalation) bioavailability has been adopted in the derivation of an HIL. It is noted that a site-specific assessment of bioavailability can be undertaken where required.
Review of dermal absorption by MfE (2011) indicated the following with respect to copper: ‘Organometallic copper salts are indicated to penetrate the skin, producing anti-inflammatory and anti-arthritic activity (Guy et al. 1999), but limited quantitative dermal absorption data is available. The available data indicates permeability coefficients for copper as copper chloride and copper sulphate are in the order of 0.013 × 10⁻⁴ to 0.16 × 10⁻⁴ cm/h after 72 h. Although higher permeability coefficients are observed during initial exposures they decrease over the time of exposure (Guy et al. 1999). While this data provides an indication of dermal absorption of copper, they are not readily amenable to expression as a skin absorption factor. Further, in these studies the copper salts were applied in petroleum, aqueous gels or emulsions; it is likely that lower absorption/permeability coefficients would be observed for copper present in contaminated soil. Finally, all the agencies considered in this report that have developed soil guideline values for copper (Canada, The Netherlands, US) have considered dermal exposure to copper to be negligible (NCSRP 1995; Baars et al. 2001; US EPA 2003).’ Consistent with the above, dermal absorption of copper has been considered to be negligible.
Copper is not volatile and inhalation exposures associated with particulates outdoors and indoors are expected to be of less significance than ingestion of soil. While likely to be negligible, potential inhalation exposures associated with dust have been considered in the HIL derived.
Copper is a micronutrient required by plants for metabolism. Plant growth is affected by copper deficiency as well as toxicity associated with excess levels of copper. The potential for plant uptake and toxicity will be dependent on the form present. Review by MfE (2011) notes that copper is phytotoxic at relatively low tissue concentrations and plant uptake will be limited by its toxic effect on plants. A tissue copper concentration of 1520 mg/kg (dry weight) is considered to be representative of excessive tissue concentration in agronomic species, while a 10% growth yield decrease is most likely at 1030 mg/kg (dry weight) tissue copper concentrations.
Given the variable uptake of copper by plants from soil, and the known phytotoxic effects of copper, it is recommended that a maximal concentration of copper in produce is used in preference to a plant uptake factor (which is not limiting). A produce concentration of 30 mg/kg (dry weight) has been considered by MfE (2011) as the maximum amount of copper likely to be taken up in home-grown vegetables. Vegetables containing greater than this concentration would be so stunted and deformed that harvesting would be unlikely.
To obtain the additional background intake, a child’s produce consumption (0.048 kg DW[2]/day) was multiplied by 30 mg/kg and divided by the child body weight of 15.5 kg to obtain the maximum additional background daily intake for 100 % of produce being home-grown. For the consumption of 10% home-grown produce, this results in an additional intake of 0.009 mg/kg/day being considered.
It is noted that the inclusion of home-grown produce in the calculations presented for HIL A results in some double counting of intakes from fruit and vegetable produce (also included in background intakes). Given the low tissue concentration required for phytotoxicity it is expected that existing background intakes already address maximum amounts of copper uptake, however, to be conservative the additional uptake calculated here has been assumed to be in addition to the background intakes (noted below).
Review of current information from Australia with respect to copper indicates the following:
RIVM (2001) reviewed background intakes, which were considered to be 30 µg/kg/day for adults. Based on data from Australia and New Zealand for infants and young children, background intakes may comprise approximately 0.08 mg/kg/day, which is 60% of the recommended oral TRV.
The International Agency for Research on Cancer (IARC) has not classified copper and copper compounds, however copper 8-hydroxyquinoline has been classified (IARC 1977) as Group 3—not classifiable. It is noted that US EPA has assessed copper as Group D: not classified.
Copper is not considered to be carcinogenic and therefore the consideration of a threshold dose-response approach is considered appropriate.
The following threshold values are available from Level 1 Australian and International sources:
Source | Value | Basis/Comments |
Australian | ||
ADWG (NHMRC 2011) | TDI = 0.5 mg/kg/day | The ADWG (NHMRC 2011) derived a health-based guideline of 2 mg/L based on the provisional TDI of 0.5 mg/kg/day derived from WHO (1982). The evaluation from 1982, which has not been updated, identified a range of provisional maximum tolerable daily intakes (PMTDI) of 0.05-0.5 mg/kg/day. The ADWG have adopted the upper end of the range provided. |
OCS (2012) | ADI = 0.2 mg/kg/day | The ADI of 0.2 mg/kg/day is also listed on the current ADI list (OCS 2012), where it is noted to have been set in June 2005, based on the upper safe limit for adults set by FSANZ. |
FSANZ (2003) | TL = 0.2 mg/kg/day | FSANZ (2003) has adopted a tolerable limit of 0.2 mg/kg/day for coppe,r referenced from WHO (‘Trace Elements in Human Nutrition’, 1996). |
International | ||
WHO (2011) | TDI = 0.14 mg/kg/day | The current WHO DWG (2011) have also derived a guideline of 2 mg/L, however they also note that intakes derived from consuming 23 L water per day are not expected to exceed a tolerable upper intake level of 10 mg/day (IOM 2001). This upper intake would be equal to a TDI of 0.14 mg/kg/day for a 70 kg adult. Copper is noted to be in the current WHO list for rolling revisions to the drinking water guidelines. |
RIVM (2001) | TDI = 0.14 mg/kg/day TC = 0.001 mg/m3 | RIVM (2001) identified an oral TDI of 0.14 mg/kg/day, based on a LOAEL from a chronic oral study in mice. This study was not available at the time when WHO conducted its evaluation. The TDI derived is noted to be above the minimum dietary requirements for copper. Despite a poor database, RIVM also derived an inhalation TC of 0.001 mg/m3 based on a NOAEC of 0.1 mg/kg/day (adjusted) associated with lung and immune system effects from a subacute study with rabbits and an uncertainty factor of 100. It is not recommended that the inhalation TC be considered in the derivation of a soil HIL, due to the limited data available with respect to chronic inhalation exposures to copper. |
ATSDR (2004) | No chronic MRLs available |
|
US EPA (IRIS 2012) | No evaluation available |
|
Based on the available data, an oral TRV of 0.14 mg/kg/day is recommended to be adopted for the derivation of soil HILs. The value is based on a tolerable upper limit (IOM 2001) and is similar to the TDI currently adopted by RIVM (2001), OCS (2012) and FSANZ (2003) (where the value may be rounded). The recommended TRV is considered relevant for the assessment of copper intakes from oral, dermal and inhalation routes of exposure.
On the basis of the discussion above, the following toxicity reference values (TRVs) have been adopted for copper in the derivation of HILs:
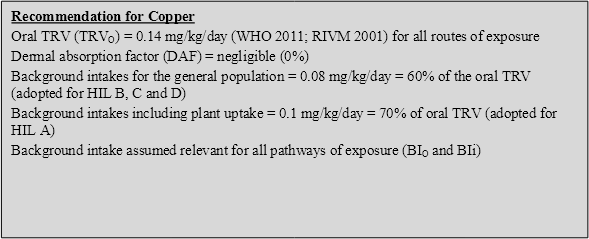
On the basis of the above, the following HILs have been derived for copper (refer to Appendix B for equations used to calculate the HILs and Appendix C for calculations):
HIL Scenario | HIL (mg/kg) | Percentage Contribution from Exposure Pathways | |||
Ingestion of Soil/Dust | Ingestion of Home-grown Produce | Dermal Absorption of Soil/Dust | Inhalation (dust) | ||
Residential A | 6000 | 100 | Included in background | -- | <1 |
Residential B | 30 000 | 100 | -- | -- | <1 |
Recreational C | 17 000 | 100 | -- | -- | <1 |
Commercial D | 240 000 | 100 | -- | -- | <1 |
-- Pathway not included in derivation of HIL
ATSDR 2004, Toxicological Profile for Copper. Agency for Toxic Substances and Disease Registry, United States Department of Health and Human Services, Atlanta, Georgia, USA.
DEC 2003, Ambient Air Quality Research Project (1996-2001), Internal working paper no. 4, Ambient concentrations of heavy metals in NSW, Department of Environment and conservation (NSW).
FSANZ 2003, The 20th Australian Total Diet Survey, A total diet survey of pesticide residues and contaminants [website: http://www.anzfa.gov.au/].
FSANZ 2011, The 23rd Australian Total Diet Study, Food Standards Australia and New Zealand.
IARC 1977, Summaries & Evaluations, Copper 8-hydroxyquinoline, International Agency for Research on Cancer (IARC), vol. 15, p.103.
IOM 2001, Dietary reference intakes for vitamin A, vitamin K, arsenic, boron, chromium, copper, iodine, iron, manganese, molybdenum, nickel, silicon, vanadium and zinc, A report of the Panel on Micronutrients, Subcommittees on Upper Reference Levels of Nutrients and of Interpretation and Use of Dietary Reference Intakes, and the Standing Committee on the Scientific Evaluation of Dietary Reference Intakes. Food and Nutrition Board, Institute of Medicine, Washington, DC, National Academy Press.
MfE 2011, Toxicological intake values for priority contaminants in soil, New Zealand Ministry for the Environment, Wellington, New Zealand.
NEHF 1997, Copper. National Environmental Health Monographs, Metal Series No. 3, National Environmental Health Forum.
NEPC 1999, Schedule B (7a), Guideline on Health-Based Investigation Levels, National Environment Protection (Assessment of Site Contamination) Measure, National Environment Protection Council, Adelaide, Australia.
NHMRC 2011, National water quality management strategy. Australian drinking water guidelines, National Health and Medical Research Council, Australia.
OCS 2012, ADI List, Acceptable Daily Intakes for Agricultural and Veterinary Chemicals, Current to 31 March 2012, Australian Government, Department of Health and Ageing, Office of Chemical Safety (OCS), available from: http://www.health.gov.au/internet/main/publishing.nsf/content/E8F4D2F95D616584CA2573D700770C2A/$File/ADI-apr12.pdf.
RIVM 2001, Re-evaluation of human-toxicological Maximum Permissible Risk levels, National Institute of Public Health and the Environment, Bilthoven, Netherlands . available from: http://www.rivm.nl/bibliotheek/rapporten/711701025.html.
Sloof, W et al. (eds) 1989, Integrated Criteria Document Copper, Report No. 758474009, National Institute of Public Health and Environmental Protection, Bilthoven, Netherlands.
Soong, FS & Emmett, AJ 1993, ‘Assessment and Management of CCA Timber Preservation Plants’, presented in the proceedings of the Second National Workshop on the Health Risk Assessment and Management of Contaminated Sites, Contaminated Sites Monograph Series, No. 2.
US EPA (IRIS 2012), Data and information available from the Integrated Risk Information System, an online database, available from http://www.epa.gov/iris/.
WHO, 1998. Environmental Health Criteria 200 Copper, International Programme on Chemical Safety, World Health Organization, Geneva.
WHO 2011, Guidelines for drinking-water quality, 4th edn, World Health Organization, Geneva, available from http://www.who.int/water_sanitation_health/dwq/chemicals/en/index.html.
Several comprehensive reviews of lead in the environment and its toxicity to humans are available and should be consulted for more detailed information (ATSDR 2007; IARC 2006; WHO 1989; WHO 2000). The following provides a summary of the key aspects of lead that are relevant to the derivation of a soil HIL.
Lead (Pb) is a naturally occurring element found in the Earth’s crust at an average concentration of approximately 15 to 20 mg/kg. It is most commonly found in ores such as galena (PbS), anglesite (PbSO4) and cerussite (PbCO3). Lead is a bluish-grey, soft, dense, malleable, corrosion-resistant metal that is solid at room temperature and has a low melting point. It exists in three oxidation states—Pb(0) (metallic lead), Pb(II) and Pb(IV). The most common oxidation state of lead is Pb(II) (ATSDR 2007).
Lead is of primary use in a wide range of materials including batteries, metal alloys, X-ray shielding materials, ammunition, chemical-resistant linings and pigments. Lead has been widely used historically as an additive in petrol and also in many paints (ATSDR 2007).
Health effects associated with exposure to inorganic lead and compounds include, but are not limited to, neurotoxicity, developmental delays, hypertension, impaired haemoglobin synthesis, and male reproductive impairment. The most sensitive targets for lead toxicity are the developing nervous system, the haematological and cardiovascular systems and the kidney. However, due to the multi-modes of action of lead in biological systems, lead could potentially affect any system or organ in the body. The effects of lead exposure have often been related to the blood lead content, which is generally considered to be the most accurate means of assessing exposure (MfE 2011).
The derivation of the previous HIL (HIL A = 300 mg/kg) for lead is presented by Maynard (1991). In summary, the HIL was derived on the basis of the following:
Based on review of the available approaches a soil guideline of 300 mg/kg for HIL A was determined.
Ingestion of soil and dust is considered the most significant pathway of exposure for inorganics in soil. The consideration of bioavailability and inclusion of other exposure pathways in the derivation of a soil HIL has been further reviewed, as noted below.
A significant amount of data is available in relation to the bioavailability of lead. In addition, a number of international agencies have considered bioavailability in the derivation of soil guideline values. The available approaches include (MfE 2011):
It is noted that review by MfE (2011) considered there to be issues in the range of lead bioavailability/ bioaccessibility values, no agreed laboratory methods available and uncertainties with the doseresponse used for blood lead. Hence the MfE has considered 100% bioavailability in the derivation of a soil guideline value.
Bioavailability has been considered in the derivation of the previous HIL, with 50% adsorption considered for dietary and water intakes, 40% absorption from inhaled particulates and 30% from ingested soil/dust considered in the assessment of intakes from other sources (background) (Maynard 1991).
Review of bioavailability by IARC (2006) identified a range of values and factors that have the potential to affect absorption. Based on the range of bioavailability values presented by IARC, an oral bioavailability of 50% (from soil/dust, food and water) is considered to be sufficiently conservative. These values have been considered in the derivation of HILs.
Studies relating to dermal absorption of lead are reviewed by ATSDR (2007) where low levels of inorganic lead (<1% and much lower (well below 0.1%)) were reported. IARC (2006) notes that in the limited number of studies available, dermal absorption of inorganic lead is negligible, although slightly enhanced by high perspiration rates. Based on the available data, dermal absorption of lead has been considered to be negligible, consistent with the approach adopted in New Zealand (MfE 2011) and the UK (DEFRA & EA 2002)
Lead is not volatile and inhalation exposures associated with particulates outdoors and indoors are expected to be of less significance than ingestion of soil. While likely to be negligible, potential inhalation exposures associated with dust have been considered in the HIL derived.
IARC (2006) has noted that plant uptake of lead from soil is low due to the low bioavailability of lead in soil and its poor translocation from the root to the shoot. Of all the toxic heavy metals, lead is considered the least phytoavailable. While soil properties affect the potential for uptake and translocation, water soluble and exchangeable lead that is readily available for uptake by plants constitutes only 0.1% of the total lead in most soils. Hence a chelate (such as EDTA) is used to increase lead uptake and translocation where phytoremediation is required.
For the derivation of soil HILs it has been assumed that the small amount of lead that may be taken up into home-grown produce is essentially accounted for in the consideration of intakes from the diet. In areas where the form of lead in soil is more soluble and available for plant uptake a site-specific assessment (including the sampling of home-grown produce) should be considered.
Information available from Australia in relation to background intakes of lead include the following:
The International Agency for Research on Cancer (IARC 2006) has classified inorganic lead as Group 2A—probably carcinogenic to humans. Organolead was classified as Group 3—not classifiable.
It is noted that US EPA (available from IRIS 2012) has classified lead and compounds (last reviewed in 1993) as Class B2—probable human carcinogen.
Some evidence of carcinogenic effects has been associated with exposure to lead (in experimental animals, with inadequate evidence in humans). It is noted ,however, that there is evidence from human studies that adverse effects other than cancer may occur at lower lead levels (WHO 2011), hence the adoption of a guideline that addresses the most sensitive non-carcinogenic effects is considered to also be adequately protective of carcinogenic effects.
Blood lead levels have been found to be a good indicator of exposure to lead. A blood lead level reflects lead’s dynamic equilibrium between adsorption, excretion and deposition in soft and hard tissues. Epidemiological studies (and expert groups) do not provide definitive evidence of a threshold in relation to blood lead levels and neurotoxic effects (US EPA (IRIS 2012), ATSDR 2007, DEFRA & EA 2002 and RIVM 2001) but blood lead goals and associated intakes have been identified by various agencies for the assessment of lead exposures by the general public. The NHMRC has noted that there are no benefits of human exposure to lead and that all demonstrated effects of exposure are adverse.
The following threshold values are available from Level 1 Australian and International sources:
Source | Value | Basis/Comments |
Australian | ||
ADWG (NHMRC 2011) | PTDI = 0.0035 mg/kg/day | The PTDI considered in the ADWG (NHMRC 2011) is based on the evaluation provided by JECFA (WHO 1993 and WHO 2011) associated with a PTWI of 0.025 mg/kg/week (see comments below). |
NHMRC (2009) | PbB goal <10 µg/dL | Blood lead goal set in 1987 and re-iterated in 1993. The document provides a series of graduated response levels associated with concentrations ranging from 1525 µg/dL. The guidance was rescinded by the NHMRC on 31/12/2005. NHMRC (2009) notes that the value of 10 µg/dL was never intended as a ‘safe’ level of exposure of a ‘level of concern’, however they still recommend that goal of <10 µg/dL for all Australians. |
NEPM (2003) | Air Quality Goal = 0.5 µg/m3 | Air guideline (based on an annual average) set by NEPM. Basis of the value is not stated; however it is the same as that set by WHO (2000). |
International | ||
JECFA (WHO 1993) | PTWI = 0.025 mg/kg | In 1972 the JECFA set a PTWI of 0.05 mg/kg. The current PTWI was established in 1986 for infants and children based on metabolic studies showing a mean daily intake of 34 µg/kg was not associated with an increase in blood lead levels or in the body burden of lead. An intake of 5 µg/kg was associated with an increase in lead retention. The PTWI was reconfirmed in 1993 and extended to all age groups. The PTWI was estimated to be responsible for a blood lead concentration of 5.6 µg/dL for a 10 kg child, which is thought to be below that associated with effects on intellectual performance. This PTWI was withdrawn by JECFA in 2010 (WHO 2010) as the committee could no longer consider the value to be health-protective. The committee estimated that the previous PTWI is associated with a decrease of at least 3 intelligence quotient (IQ) points in children and an increase in systolic blood pressure of approximately 3 mm Hg in adults. Both these effects were considered important within a population. The committee did not provide any indication of a suitable threshold for the key adverse effects of lead and no alternate PTWI was established. |
WHO (2011) | No value provided | WHO has adopted a provisional guideline of 0.01 mg/L based on treatment performance and analytical achievability. The WHO evaluation notes the withdrawal of the JECFA PTWI (WHO 1993) and that no new value is available. The review notes that there does not appear to be a threshold for the key effects of lead. |
WHO (2000) | TC = 0.5 µg/m3 | Air guideline (based on an annual average) established for lead, based on an objective of 98% of the general population having a blood lead concentration of <10 µg/dL, where the median blood lead levels would be no more than 5.4 µg/dL. |
RIVM (2001) | PTWI = 0.025 mg/kg | Adopted the JECFA (WHO 1993) evaluation. |
DEFRA & EA (2002) | PbB goal <10 µg/dL | Guideline established for adults and children associated with exposures from all routes and sources. It is considered that neurotoxicity effects associated with lead exposure have no threshold and therefore an additional requirement to keep exposures from all sources as low as practically possible is noted. |
ATSDR (2007) | No MRLs derived | No MRLs derived as some health effects associated with exposure to lead occur at blood lead levels as low as to be essentially without a threshold. |
US EPA (IRIS 2012) | No RfD derived | No threshold values derived by the US EPA as it is noted that ‘It appears that some of these effects, particularly changes in the levels of certain blood enzymes and in aspects of children's neurobehavioral development, may occur at blood lead levels so low as to be essentially without a threshold’. |
The available goals reflect a blood lead goal of <10 µg/dL from all sources, which is considered relevant for all exposures and sources.
The HILs for lead have been previously established using both the JECFA (WHO 1993) PTWI and the blood lead model. Given that the PTWI has now been withdrawn and is no longer considered adequately protective, the HIL has been established on the basis of the blood lead model, on the basis of the blood lead goal of <10 µg/dL for all routes of exposure and all sources.
The most commonly used (and recommended) blood lead model relevant to the most sensitive age group, infants and young children, is the IEUBK model (win 32, Model 1.1). On the basis of the assumptions presented in Appendix C (consistent with the pathway-specific assumptions outlined in this review and reviewed in line with the use of the IEUBK model in Port Pirie (South Australia)), HIL A = 306 mg/kg. A value of around 300 mg/kg can also be confirmed using the model LeadSpread available from the California Department of Toxic Substances Control.
On the basis of the above, the previous soil HIL of 300 mg/kg for lead has been reaffirmed. HILs B, C and D have also been reaffirmed on the basis of the blood lead model.
HIL Scenario | HIL (mg/kg) |
Residential A | 300 |
Residential B | 1200 |
Recreational C | 600 |
Commercial D | 1500 |
ATSDR 2007, Toxicological Profile for Lead, Agency for Toxic Substances and Disease Registry (ATSDR) United States Department of Health and Human Services, Atlanta, Georgia, USA.
DEC 2003, Ambient Air Quality Research Project (1996-2001), Internal working paper no. 4, Ambient concentrations of heavy metals in NSW, Department of Environment and conservation (NSW).
DEFRA & EA 2002, Contaminants in Soil: Collation of Toxicological Data and Intake Values for Humans. Lead, Department for Environment, Food and Rural Affairs and the Environment Agency, Bristol, UK.
FSANZ 2003, The 20th Australian Total Diet Survey, A total diet survey of pesticide residues and contaminants, website: http://www.anzfa.gov.au/.
FSANZ 2011, The 23rd Australian Total Diet Study, Food Standards Australia and New Zealand.
IARC 2006, IARC Monographs on the Evaluation of Carcinogenic Risks to Humans, Volume 87, Inorganic and Organic Lead Compounds.
Maynard, EJ 1991., ‘Setting Response Levels for Lead (Pb)’, presented in the proceedings of the First National Workshop on the Health Risk Assessment and Management of Contaminated Sites, Contaminated Sites Monograph Series, No. 1.
MfE 2011, Toxicological intake values for priority contaminants in soil, New Zealand Ministry for the Environment, Wellington, New Zealand.
NEPM 2003, National Environment Protection (Ambient Air Quality) Measure, as amended, 2003.
NHMRC 2011, National water quality management strategy. Australian drinking water guidelines, National Health and Medical Research Council, Australia.
NHMRC 2009, Information Paper, Blood Lead Levels for Australians, National Health and Medical Research Council, Australia.
RIVM 2001, Re-evaluation of human-toxicological Maximum Permissible Risk levels, National Institute of Public Health and the Environment, Bilthoven, Netherlands, available from: http://www.rivm.nl/bibliotheek/rapporten/711701025.html.
US EPA (IRIS 2012), Data and information available from the Integrated Risk Information System, an online database, available from http://www.epa.gov/iris/.
WHO various, Joint FAO/WHO Expert Committee on Food Additives (JECFA) evaluations provided in 1972 (no. 4), (No 21) and 1993 (Technical report No 837), available from http://www.inchem.org/ .
WHO 1989, Environmental Health Criteria 85, Lead – Environmental Aspects.
WHO 2000, Air Quality Guidelines for Europe, 2nd edn, WHO Regional Publications, European Series No 91, World Health Organization, Copenhagen.
WHO 2010, Joint FAO/WHO Expert Committee on Food Additives (JECFA), Seventy-third meeting, Geneva, Summary and Conclusions, Issue 24.
WHO 2011, Guidelines for drinking-water quality, 4th edn, World Health Organization, Geneva, available from http://www.who.int/water_sanitation_health/dwq/chemicals/en/index.html.
Several comprehensive reviews of manganese in the environment and its toxicity to humans are available and should be consulted for more detailed information (ATSDR 1997 and 2008; WHO 1999 and 2004; Health Canada 2008). The following provides a summary of the key aspects of manganese that are relevant to the derivation of a soil HIL.
Manganese (Mn) is the 12th most abundant element and comprises approximately 0.01% of the Earth’s crust. Manganese does not occur naturally in its elemental state and is most commonly found in mineral form as oxides, carbonate and silicates. Elemental manganese is a steel-gray coloured solid at room temperature. Manganese can exist in a relatively wide range of oxidation states from -3 to +7. The most common oxidation state of manganese is Mn (IV), the form associated with manganese dioxide (MnO2) (ATSDR 2008).
Manganese is used to increase stiffness, hardness and strength in a range of alloys including carbon steel, stainless steel, high-temperature steel, cast iron and super-alloys. Manganese is additionally used in the manufacture of dry cell batteries, matches, fireworks, porcelain, brick colourant, glass, animal feed, and plant fertilisers. Strongly oxidising forms of manganese, such as potassium permanganate are used as a disinfectant, an anti-algal agent, a water purifying agent, for metal cleaning, tanning and as bleach (ATSDR 2008).
Manganese is a dietary essential element that is required in several important processes including bone mineralisation, energy metabolism, metabolic regulation, and the formation of glycosaminoglycans (ATSDR 2008). As it is an essential element ,adverse effects can occur as a result of deficiency as well as toxicity associated with excess intake from contamination.
The derivation of the previous HIL (HIL A = 1500 mg/kg) for manganese is presented by Lindon & Sabordo (1996). In summary, the HIL was derived on the basis of the following:
Ingestion of soil and dust is considered the most significant pathway of exposure for inorganics in soil. The consideration of bioavailability and inclusion of other exposure pathways in the derivation of a soil HIL has been further reviewed, as noted below.
Bioavailability has not been considered in the previous HIL, as insufficient data is available to adequately define the bioavailability of copper from soil. On this basis, a default approach of assuming 100% oral (and inhalation) bioavailability has been adopted in the derivation of an HIL. It is noted that a site-specific assessment of bioavailability can be undertaken where required.
Limited data is available on the dermal absorption of manganese. Absorption of inorganic manganese is not considered to occur to any great extent (Lindon & Sabordo 1996). While no studies relating to dermal absorption of inorganic manganese by ATSDR (2008) are available, the review noted that for inorganic manganese compounds, dermal exposure is not a typical pathway of exposure because manganese does not penetrate the skin readily. However, for organic manganese, dermal exposure is a possibility. The HIL derived relates to inorganic manganese and hence organic compounds have not been considered further.
On the basis of the above, there is no data available to suggest that dermal absorption of manganese is significant and hence it has been assumed to be negligible in the derivation of HILs.
Manganese is not volatile however WHO (1999) notes the following: ‘Little is known about the relative toxicity of different manganese compounds. Inhaled manganese compounds tend to produce more severe toxicity than ingested manganese compounds. This is probably attributable to the difference in route-specific uptake of manganese from the lung (often assumed at 100%) compared with the gastrointestinal tract (35%). Studies have shown that a greater proportion of a manganese dose appears in the blood and brain of rats exposed via inhalation or intranasal instillation than when the same dose is given orally.’
Inhalation exposures associated with particulates outdoors and indoors are expected to be of less significance than ingestion of soil, however, due to the toxicity of inhaled manganese, it is relevant to include this pathway in the derivation of soil HILs.
Manganese is a micronutrient required by plants for metabolism. Plant growth is affected by manganese deficiency as well as toxicity associated with excess levels of manganese. In general, natural levels of manganese in soil are sufficiently high to address deficiencies but where plant deficiencies occur it is typically due to manganese being present in a form not available for plant uptake. Hence the potential for plant uptake and toxicity will be dependent on the form present. While a comprehensive review of plant uptake has not been conducted in this review, the potential for manganese uptake into plants has been considered in the derivation of HIL A.
Based on the above, the uptake of manganese into all crops has been considered in the derivation of the HIL A. Limited plant uptake data is available, and translocation into above-ground crops is assumed to be negligible, hence the value presented by RAIS (2010) of 0.068 mg/kg fresh produce per mg/kg soil produce has been considered for root and tuber crops only.
It is noted that the inclusion of home-grown produce in the calculations presented for HIL A results in some double counting of intakes from fruit and vegetable produce (also included in background intakes). To address this in the derivation of HIL A, half the intake estimated to be derived from home-grown produce is assumed to be already accounted for in the total background intake (noted below).
Review of current information from Australia indicates the following:
The International Agency for Research on Cancer (IARC) has not classified manganese. US EPA has classified manganese as Group D—not classifiable.
Insufficient data is available to assess wither manganese is carcinogenic to humans. Some in vitro and in vivo assays are available for manganese, with studies providing conflicting results. Overall review of the data shows that some chemical forms of manganese have mutagenic potential, but most results are inconsistent and hence no overall conclusion as to the genotoxic potential associated with exposure to manganese can be determined (ATSDR 2008). On this basis, a threshold approach is considered appropriate, based on the most sensitive effect associated with manganese exposure (CNS effects).
The following threshold values are available from Level 1 Australian and International sources:
Source | Value | Basis/Comments |
Australian | ||
ADWG (NHMRC 2011) | Safe level of 10 mg/day | The ADWG (NHMRC 2011) derived a health based guideline of 0.5 mg/L based on a level of 10 mg/day, which is the amount of manganese that can be safely consumed from all sources, referenced from WHO 1973 evaluation. |
International | ||
WHO (2011) | TDI = 0.05 mg/kg/day | The current WHO DWG (2011) has not established a guideline for drinking water, as the compound is not considered to be of health concern at the levels found in drinking water. The review notes that a health-based guideline of 0.4 mg/L can be derived based on the upper range value of manganese intake of 11 mg/day from dietary studies (IOM 2002) and an uncertainty factor of 3 (to allow for the increased bioavailability of manganese from water), which results in a TDI of 0.05 mg/kg/day for a 70 kg adult. The guidance also notes that the presence of manganese in drinking water will be objectionable (water discolouration) above 0.05 mg/L. |
WHO (1999) | TC = 0.00015 mg/m3 | Tolerable concentration or guideline value derived by WHO on the basis of the same study considered by the US EPA (IRIS 2012) and ATSDR (2008), with the guideline value derived on the basis of a NOAEL of 0.03 mg/m3 for neurotoxicological effects from a benchmark dose (BMD) analysis, adjustment for continuous exposure (5/7 x 8/24) and an uncertainty factor of 50. The value derived is similar to that from ATSDR (2008) with the main difference being the application of the BMD model. No oral guideline value was provided. |
Health Canada (2008) | RfC = 0.00005 mg/m3 | RfC derived based on most sensitive benchmark dose analysis associated with neurotoxicological effects in an occupational inhalation study. A range of RfCs were derived that varied from 0.000050.00014 mg/m3. The range derived is consistent with values derived from ATSDR and WHO. |
ATSDR (2008) | Interim oral value of 0.16 mg/kd/day Inhalation MRL = 0.0003 mg/m3 | No oral MRLs have been derived by ATSDR; however they provide an interim guidance value of 0.16 mg/kg/day based on a tolerable upper intake level of 11 mg/day. Chronic inhalation MRL derived on the basis of a benchmark concentration (at the lower 95% confidence limit for the level of manganese exposure expected to result in 10% response rate) BMCL10 (adjusted for continuous exposure) of 0.03 mg/m3 associated with neurobehavioural effects in an occupational study and an uncertainty factor of 100. |
US EPA (IRIS 2012) | RfD = 0.14 mg/kg/day RfC = 0.00005 mg/m3 | RfD (last reviewed in 1993) based on a NOAEL of 0.14 mg/kg/day associated with CNS effects in a number of dietary human studies and an uncertainty factor of 1. US EPA also notes that individual requirements for and effects associated with manganese exposure may be highly variable and that some individuals may consume more than 10 mg/day of manganese without any cause for concern. RfC (last reviewed in 1993) based on the same study considered by ATSDR (2008), however US EPA considered the LOAEL (HEC) of 0.05 mg/m3 and applied an uncertainty factor of 1000. |
As manganese toxicity via inhalation has been shown to be more significant than via oral intakes, it is reasonable that quantitative values for inhalation exposures are significantly lower than for oral exposures. Based on the available data, an oral threshold value of 0.16 mg/kg/day as derived by ATSDR (2008) is based on the most recent detailed review of manganese toxicity. It is noted that the basis for the value is consistent with the upper range of manganese intake considered by US EPA (IRIS 2012), NHMRC (2011) and WHO (2011, if the additional uncertainty factor of 3 were not considered for exposures from soil (based on increased bioavailability from water)).
The quantitative values available for the assessment of inhalation exposures are all essentially based on the same critical study (with the exception of Health Canada), with the main difference being the approach used to quantify a threshold value from the study data (using different benchmark dose models or not using a benchmark dose model), and consideration of uncertainty factors. The air guideline value derived by WHO (1999) is recommended based on the use of a benchmark dose analysis which is also within the range of threshold values derived by Health Canada (2008) using a number of benchmark dose approaches using a different study. The value is also similar to that derived by ATSDR (2008).
On the basis of the discussion above, the following toxicity reference values (TRVs) have been adopted for manganese in the derivation of HILs:

On the basis of the above, the following HILs have been derived for manganese (refer to Appendix B for equations used to calculate the HILs and Appendix C for calculations):
HIL Scenario | HIL (mg/kg) | Percentage Contribution from Exposure Pathways | |||
Ingestion of Soil/Dust | Ingestion of Home-grown Produce | Dermal Absorption of Soil/Dust | Inhalation (dust) | ||
Residential A | 3800 | 32 | 49 | -- | 19 |
Residential B | 14 000 | 29 | -- | -- | 71 |
Recreational C | 19 000* | 80 | -- | -- | 20 |
Commercial D | 60 000 | 18 | -- | -- | 82 |
-- Pathway not included in derivation of HIL
* HIL is higher than HIL B (contrary to other HILs derived) due to the more significant influence of the dust inhalation pathway in the derivation of HILs A and B, and lower contribution for HIL C.
ATSDR 1997, Toxicological Profile for Manganese, US Department of Health and Human Services, ATSDR.
ATSDR 2008. Draft Toxicological Profile for Manganese, US Department of Health and Human Services, ATSDR, available from http://www.atsdr.cdc.gov/ToxProfiles/tp.asp?id=102&tid=23.
DEC 2003, Ambient Air Quality Research Project (1996-2001), Internal working paper no. 4, Ambient concentrations of heavy metals in NSW, Department of Environment and Conservation, (NSW).
FSANZ 2003, The 20th Australian Total Diet Survey, A total diet survey of pesticide residues and contaminants, website: http://www.anzfa.gov.au/.
FSANZ 2011, The 23rd Australian Total Diet Study, Food Standards Australia and New Zealand.
Health Canada 2008, Human Health Risk Assessment for Inhaled Manganese, Draft.
IOM 2002, Dietary reference intakes for vitamin A, vitamin K, arsenic, boron, chromium, copper, iodine, iron, manganese, molybdenum, nickel, silicon, vanadium and zinc, pp. 10-1 to 10-22, Institute of Medicine, Food and Nutrition Board. Washington, DC, National Academy Press.
Lindon, P & Sabordo, L 1996, ‘Manganese Toxicity and the Significance of Exposure on Manganese Contaminated Soils’, presented in the proceedings of the Third National Workshop on the Health Risk Assessment and Management of Contaminated Sites, Contaminated Sites Monograph Series, No. 5, 1996.
NHMRC 2011, National water quality management strategy. Australian drinking water guidelines, National Health and Medical Research Council, Australia.
RAIS 2010, Risk Assessment Information System, website and database maintained by the Oak Ridge Operations Office, available from: http://rais.ornl.gov/.
US EPA (IRIS 2012), Data and information available from the Integrated Risk Information System, an online database, available from http://www.epa.gov/iris/.
WHO 1999, Manganese and its Compounds, Concise International Chemicals Assessment Document 12,9, World Health Organization Geneva.
WHO 2004, Manganese and its Compounds: Environmental Aspects, Concise International Chemicals Assessment Document 63, World Health Organization, Geneva.
WHO 2011, Guidelines for drinking-water quality,4th edn, World Health Organization, Geneva, available from http://www.who.int/water_sanitation_health/dwq/chemicals/en/index.html.
This review considered both inorganic mercury and methyl mercury. The derived HILs are not relevant to the assessment of elemental mercury, which should be addressed on a site-specific basis.
Several comprehensive reviews of mercury in the environment and its toxicity to humans are available and should be consulted for more detailed information (ATSDR 1999; WHO 1989, 1990, 1991, 2000a, 2003, 2004; DEFRA & EA 2002; EA 2009). The following provides a summary of the key aspects of mercury that are relevant to the derivation of a soil HIL.
Mercury is a heavy metal that exists in three oxidation states: 0 (elemental), +1 (mercurous) and +2 (mercuric). As well as the common mercurous and mercuric inorganic salts, mercury can also bind covalently to at least one carbon atom. Thus the most commonly encountered exposures associated with mercury are with elemental mercury, inorganic mercuric compounds and methyl mercury.
Mercury occurs naturally as a mineral and is widely distributed by natural and anthropogenic processes. The most significant natural source of atmospheric mercury is the degassing of the Earth’s crust and oceans and emissions from volcanoes. Man-made sources such as mining, fossil fuel combustion and industrial emissions generally contribute less on a global scale, but more on a local scale. Wet and dry deposition to land and surface water result in mercury sorption to soil and sediments.
Uses of mercury include use in the electrical and chlor-alkali industry (lamps, batteries and as cathodes in the electrolysis of sodium chloride to produce caustic soda and chloride), industrial and domestic instruments, laboratory and medical instruments and dental amalgam (mixed in proportion of 1:1 with a silver-tin alloy).
Mercury in the environment, including groundwater, exhibits complex behaviour that affects both its mobility and potential toxicity. Mercury has a low solubility in water; however, it also has the potential to form multiple species in the environment, which can lead to increased total mercury concentrations in aqueous systems. The relative toxicity of mercury is also dependent on the form in which it occurs, which is dependent on biogeochemical processes, partitioning between solids, and complexation with dissolved organic and inorganic ligands.
On the basis of the potential for long-range transport, persistence in water, soil and sediment, bioaccumulation, toxicity and ecotoxicity, mercury is considered persistent and is addressed in the 1998 UN-ECE Convention on Long-Range Transboundary Air Pollution on Heavy Metals (UN-ECE 1998). The United Nations Environment Programme (UNEP) Governing Council concluded, at its 22nd session in February 2003, after considering the key findings of the Global Mercury Assessment report, that there is sufficient evidence of significant global adverse impacts from mercury to warrant further international action to reduce the risks to humans and wildlife from the release of mercury to the environment.
The derivation of the previous HIL (HIL A for inorganic mercury = 15 mg/kg and for methyl mercury = 10 mg/kg) is presented by Imray & Neville (1996). In summary, the HILs were derived on the basis of the following:
Ingestion of soil and dust is considered the most significant pathway of exposure for inorganics in soil. The consideration of bioavailability and inclusion of other exposure pathways in the derivation of a soil HIL has been further reviewed, as noted below.
The bioavailability of different forms of mercury, by different routes of exposure, is expected to vary considerably (Imray & Neville 1996) with oral bioavailabilities reported in the range 215% for inorganic mercury and 80100% for methyl mercury. Bioavailability has not been considered in the previous HIL, as insufficient data is available to adequately define the bioavailability of the different forms of mercury from soil. On this basis, a default approach of assuming 100% oral (and inhalation) bioavailability has been adopted in the derivation of an HIL. It is noted that site-specific assessment of bioavailability can be considered where required.
Review of dermal absorption by MfE (2011) has noted that ‘Mercury reacts with skin proteins, and as a result penetration does not increase commensurably with increasing exposure concentration but rather approaches a plateau value. Mercury has a permeability coefficient in the order of 10–5 cm/h (Guy et al. 1999), which compares to permeability coefficients in the order of 10–4 cm/h for lead.’ As dermal absorption for lead has not been considered to be negligible, the potential for dermal absorption of mercury has been considered.
ATSDR (1999) notes that absorption of mercurous salts in animals can occur through the skin, though no quantitative data is available, hence a default value of 0.1% has been adopted based on the lower end of the range for metals presented by US EPA (1995).
ATSDR (1999) also noted no information was identified for absorption of methylmercury via dermal absorption. The Environment Agency (EA 2009) notes that dermal absorption of methyl mercury is reported to be similar to that of inorganic mercury. Hence the value adopted for inorganic mercury has also been adopted for methyl mercury. It is noted that dermal absorption of dimethylmercury has been reported to be of potential significance and may need to be considered in a site-specific assessment if identified as the key form of mercury in soil.
US EPA (2004) has recommended the use of a gastrointestinal absorption factor (GAF) of 7% for inorganic mercury based on mercuric chloride and other soluble mercury salt studies used in the derivation of the oral RfD. The GAF is used to modify the oral toxicity reference value to a dermal value in accordance with the US EPA (2004) guidance provided.
Inorganic mercury and methyl mercury are not volatile and inhalation exposures associated with particulates outdoors and indoors are expected to be of less significance than ingestion of soil. While likely to be negligible, potential inhalation exposures associated with dust have been considered in the HIL derived. Note that if elemental mercury is present then vapour phase issues need to be considered on a site-specific basis.
A detailed review of the plant uptake of mercury (primarily elemental and inorganic mercury) is presented in EA (2009). This review considered studies that are based on the uptake of mercury into green vegetables, root vegetables, tuber vegetables, herbaceous fruit, shrub fruit and tree fruit. The review provides recommendations on soil-to-plant uptake factors that are relevant for these types of produce. The recommendations from this review have been considered in the derivation of a residential A HIL and are summarised below for the range of crops considered:
Produce Group | Plant Uptake Factors (mg/kg produce fresh weight per mg/kg soil) (EA, 2009) |
Green vegetables | 0.0038 |
Root vegetables | 0.0069 |
Tuber vegetables | 0.0042 |
Tree fruit | 0.001 |
It is noted that the inclusion of home-grown produce in the calculations presented for HIL A results in some double counting of intakes from fruit and vegetable produce (also included in background intakes). To address this in the derivation of HIL A, half the intake estimated to be derived from home-grown produce is assumed to be already accounted for in the total background intake (noted below).
No plant uptake values are reviewed or recommended for methyl mercury. EA (2009) notes that methylated mercury compounds are likely to be more toxic to plants compared with ionic forms, though no specific data is provided. Review by US EPA (1997) suggests that methyl mercury complexes in soil are available for plant uptake and translocation. In addition, plants have some mercury methylation ability and hence the percentage of methyl mercury in plants may not originate from methyl mercury uptake from soil. Due to the level of uncertainty involved in the estimation of plant uptake of methyl mercury from soil, including the potential for phytotoxicity, it is expected that the conservative approach to the consideration of intakes from dietary sources adequately addresses potential intakes that may be derived from the consumption of 10% home-grown produce.
For inorganic mercury, review of current information from Australia indicates the following:
For methyl mercury, review of current information from Australia indicates the following:
It is noted that the potential for intakes in excess of the recommended oral TRV may occur in populations with high intakes of seafood. This may need to be considered on a site-specific basis.
The International Agency for Research on Cancer (IARC) has classified methyl mercury as Group 2B—possibly carcinogenic to humans. IARC has classified metallic mercury and inorganic mercury compounds as Group 3—not classifiable.
It is noted that US EPA has classified methyl mercury as Class C—possible human carcinogen. In addition, US EPA has classified mercuric chloride as Group C—possible human carcinogen, based on increased incidence of squamous cell papillomas of the forestomach and marginally increased incidence of thyroid follicular cell adenomas and carcinomas from long-term oral studies in rats.
Most information on the toxicity of inorganic mercury compounds comes from studies of mercuric chloride. As the water solubility and bioavailability of many other inorganic compounds, notably mercurous compounds, are much less than those of mercuric chloride, such compounds are likely to be less toxic. These issues should be considered further in a site-specific assessment, where relevant.
Carcinogenicity studies in experimental animals are available for mercuric chloride where no carcinogenic effect was observed in mice or female rats, though marginal increases in the incidence of thyroid follicular adenomas and carcinomas and forestomach papillomas were observed in male rats exposed orally. Mercuric chloride binds to DNA and induces clastogenic effects in vitro; in vivo, both positive and negative results have been reported, without a clear-cut explanation of the discrepancy. The overall weight of evidence is that mercuric chloride possesses weak genotoxic activity but does not cause point mutations (WHO 2011b). US EPA (IRIS 2012) evaluation of mercuric chloride indicates that a linear low-dose extrapolation is not appropriate as kidney tumours seen in mice occurred at doses that were also nephrotoxic.
On this basis, a threshold approach is considered appropriate, based on the most sensitive effect associated with mercury exposure. The following threshold values are available from Level 1 Australian and International sources:
Source | Value | Basis/Comments |
Australian | ||
ADWG (NHMRC 2011) | Guideline established on the basis of methyl mercury |
|
FSANZ (2003) | PTWI = 0.003 mg/kg/week | Value for total mercury referenced from JECFA 1989, based on methyl mercury. |
International | ||
WHO (2011b) | TDI = 0.002 mg/kg/day | The current WHO DWG (2011a, consistent with the review conducted in 2003) has derived a guideline of 0.006 mg/L, based on a TDI of 0.002 mg/kg/day derived from a NOAEL of 0.23 mg/day associated with kidney effects in a 26-week study in rats and an uncertainty factor of 100. A similar TDI was derived on the basis of a LOAEL of 1.9 mg/kg/day associated with renal effects in a 2-year rat study and an uncertainty factor of 1000. |
JECFA (WHO 2011a) | PTWI = 0.004 mg/kg (equivalent to PTDI = 0.0006 mg/kg/day) | Review of mercury by JECFA indicated that the predominant form of mercury indoors, other than fish and shellfish, is inorganic mercury and, while data on speciation is limited, the toxicological database on mercury (II) chloride was relevant for establishing a PTWI for foodborne inorganic mercury. A PTWI was established on the bases of a benchmark dose approach, where the BMDL10 of 0.06 mg/kg/day for relative kidney weight increases in male rates was considered as the point of departure. A 100 fold uncertainty factor was applied. |
WHO (2000b) | TC = 0.001 mg/m3 | TC or guideline value derived on the basis of a LOAEL derived from occupational studies on elemental vapour. WHO notes that this value is expected to be adequately protective of renal effects associated with exposure to inorganic mercury. |
WHO (2003) | TDI = 0.002 mg/kg/day TC = 0.0002 mg/m3 | TDI derived as noted in the DWG above. A TC in air was also derived for elemental mercury in air (0.0002 mg/m3) associated with CNS effects in workers exposed to elemental mercury. The relevance of this value to inorganic compounds is not discussed. The TC is considered relevant to inhalation exposures to elemental vapour. |
EA (2009) | TDI = 0.002 mg/kg/day TC = 0.0002 mg/m3 | TDI referenced from WHO (2003) and WHO DWG (2011). Inhalation value (converted to a dose by the EA) is based on the WHO (2003) value and has been assumed to be relevant to inorganic mercury in air. |
RIVM (2001) | TDI = 0.002 mg/kg/day | Derived on the same basis as WHO. No inhalation value is derived for inorganic mercury. |
ATSDR (1999) | No chronic MRLs derived | No chronic duration MRLs have been derived for inorganic mercury. An intermediate duration oral MRL of 0.002 mg/kg/day was derived. |
US EPA (IRIS 2012) | RfD = 0.0003 mg/kg/day
| RfD (last reviewed in 1995) based on a LOAEL of 0.226 mg/kg/day associated with autoimmune effects in a subchronic rat feeding study and an uncertainty factor of 1000. No RfC is available for inorganic mercury. An RfC of 0.0003 mg/m3 is derived for elemental mercury. |
The PTWI derived for inorganic mercury available from JECFA (WHO 2011a) is considered to provide the most current review of the available studies in relation to exposure to inorganic mercury and has been used in the derivation of a soil HIL.
Inhalation values for mercury are derived from occupational studies associated with elemental mercury vapour. While WHO (2000b) provides some comment on the potential relevance of the guideline value derived to the assessment of inorganic mercury in air, the available toxicity data does not specifically relate to the inhalation of inorganic mercury compounds likely to be present in soil contamination. EA (2009) has adopted the lower guideline value (TC) available from WHO (2003) assuming its relevance to the assessment of inorganic mercury. This approach has been adopted, though it is noted that the derived HIL is essentially the same if the WHO TC value is adopted, compared with the HIL derived if the TDI for all routes of exposure is used.
Long-term exposure to methyl mercury has induced renal tumours in mice, but only at doses at which significant nephropathy was also evident (WHO 2004). Review by the US EPA (IRIS) concluded that methyl mercury is not a potent genotoxic agent and that methyl mercury -nduced tumours in mice were likely to have a non-genotoxic mode of action. On this basis, a threshold approach is considered appropriate based on the most sensitive effect associated with methyl mercury exposure. The following threshold values are available from Level 1 Australian and International sources:
Source | Value | Basis/Comments |
Australian | ||
ADWG (NHMRC 2011) | TDI = 0.00047 mg/kg/day | Current ADWG (NHMRC 2011) derived a guideline of 0.001 mg/L on the basis of a PTWI of 0.0033 mg/kg derived from the older JECFA evaluation (see below). |
FSANZ (2003) | PTWI = 0.003 mg/kg/week (PTDI = 0.00047 mg/kg/day) | Value for total mercury referenced from older JECFA 1989, based on methyl mercury. |
International | ||
WHO (2011b) | Not established for methyl mercury | The current WHO DWG (2011b) has derived a guideline for inorganic mercury in drinking water only. |
JECFA (WHO 2004) | PTWI = 0.0016 mg/kg/week (PTDI = 0.00023 mg/kg/day) | The most current evaluation by JECFA (WHO 2004) derived a PTWI of 0.0016 mg/kg based on a steady state intake of 1.5 µg/kg/day (from review of mercury in hair and blood, a benchmark dose approach to assess the relationship between maternal hair concentrations and foetal neurotoxicity and a pharmacokinetic model). This intake is estimated to represent the exposure that would be expected to have no appreciable adverse effects on children and applying an uncertainty factor of 6.4. The PTWI was considered to be sufficient to protect developing foetuses, the most sensitive subpopulation identified. The previous evaluations by JECFA (WHO 2000a) identified a PTWI of 0.0033 mg/kg methyl mercury based on review of oral intakes of mercury and hair and blood mercury levels. Subsequent reviewed of the PTWI by JECFA in 2000 identified that the value may not be adequately protective of foetuses and infants, who are more sensitive than adults. |
EA (2009) | PTWI = 0.0016 mg/kg/week (PTDI = 00023 mg/kg/day) | Value adopted is referenced from JECFA for all routes of exposure. |
RIVM (2001) | TDI = 0.0001 mg/kg/day | Derived on the basis of a NOAEL of 1.3 µg/kg/day for developmental effects in humans (and hair concentrations), and an uncertainty factor of 10. |
ATSDR (1999) | MRL = 0.0003 mg/kg/day | Chronic oral MRL derived on the basis of a NOAEL of 0.0013 mg/kg/day (adjusted) associated with CNS effects in humans (and hair concentrations), and an uncertainty factor of 4.5. |
US EPA (IRIS 2012) | RfD = 0.0001 mg/kg/day
| RfD (last reviewed in 2001) based on a BMD of 0.0009 to 0.0015 mg/kg/day (adjusted) based on CNS effects in humans (and blood concentrations), and an uncertainty factor of 10. |
The PTWI derived for methyl mercury from JECFA (WHO 2004) is considered to be based on the most recent detailed review of available studies in relation to exposure to methyl mercury. The TRV established by JECFA is within the same range of values previously established by US EPA and ATSDR and is recommended for use in the derivation of a soil HIL for methyl mercury. No dermal or inhalation specific data is available and hence the PTWI is recommended to be adopted for all routes of exposure.
On the basis of the discussion above, the following toxicity reference values (TRVs) have been adopted for mercury in the derivation of HILs:
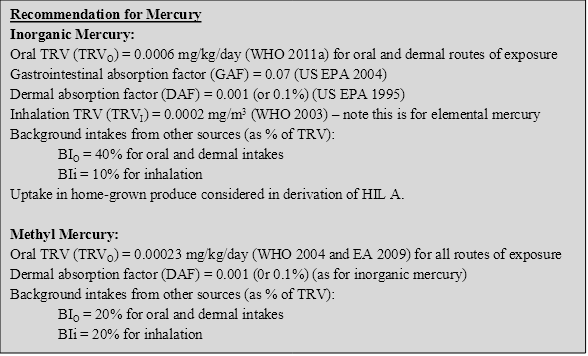
On the basis of the above, the following HILs have been derived for mercury (refer to Appendix B for equations used to calculate the HILs and Appendix C for calculations):
HIL Scenario | HIL (mg/kg) | Percentage Contribution from Exposure Pathways | |||
Ingestion of Soil/Dust | Ingestion of Home-grown Produce | Dermal Absorption of Soil/Dust | Inhalation (dust) | ||
Residential A | 40 | 66 | 21 | 13 | <1 |
Residential B | 120 | 56 | -- | 44 | <1 |
Recreational C | 80 | 72 | -- | 28 | <1 |
Commercial D | 730 | 48 | -- | 52 | 1 |
-- Pathway not included in derivation of HIL
The previous HIL A for methyl mercury was 10 mg/kg. Direct calculation of the revised HIL on the basis of the above assumptions results in the calculation of an HIL A of 7 mg/kg. Given the level of uncertainty and variability in the estimation of intakes from other sources (background, particularly from fish) and the difficulty in obtaining reliable analytical data, the existing HIL A of 10 mg/kg has been retained. The HILs for other exposure scenarios have been calculated directly on the basis of the assumptions outlined in this document.
HIL Scenario | HIL (mg/kg) | Percentage Contribution from Exposure Pathways | |||
Ingestion of Soil/Dust | Ingestion of Home-grown Produce | Dermal Absorption of Soil/Dust | Inhalation (dust) | ||
Residential A | 10 | 99 | -- | 1 | <1 |
Residential B | 30 | 95 | -- | 5 | <1 |
Recreational C | 13 | 97 | -- | 3 | <1 |
Commercial D | 180 | 93 | -- | 7 | <1 |
-- Pathway not included in derivation of HIL
It is noted that the analysis of methyl mercury in soil can be difficult and hence the reliability/quality of the data collected should be considered in any assessment of methyl mercury.
ATSDR 1999, Toxicological Profile for Mercury, US Department of Health and Human Services, ATSDR, available from: http://www.atsdr.cdc.gov/ToxProfiles/tp.asp?id=115&tid=24
DEFRA & EA 2002, Contaminants in Soil: Collation of Toxicological Data and Intake Values for Humans. Mercury. Department of Environment, Food and Rural Affairs and the Environment Agency, Bristol, UK.
EA 2009, Contaminants in soil: updated collation of toxicological data and intake values for humans, Mercury, Science Report: SC050021, Environment Agency, Bristol, UK.
FSANZ 2003, The 20th Australian Total Diet Survey, A total diet survey of pesticide residues and contaminants, website: http://www.anzfa.gov.au/.
FSANZ 2011, The 23rd Australian Total Diet Study, Food Standards Australia and New Zealand.
Imray, P & Neville, G 1996, ‘Setting a Health-Based Investigation Threshold for Mercury in Soil’, presented in the proceedings of the Third National Workshop on the Health Risk Assessment and Management of Contaminated Sites, Contaminated Sites Monograph Series, No. 5, 1996.
MfE 2011, Toxicological intake values for priority contaminants in soil, New Zealand Ministry for the Environment, Wellington, New Zealand.
NHMRC 1999, Dental Amalgam and Mercury in Dentistry, Report of an NHMRC working party.
NHMRC 2011, National water quality management strategy. Australian drinking water guidelines, National Health and Medical Research Council, Australia.
RIVM 2001, Re-evaluation of human-toxicological Maximum Permissible Risk levels, National Institute of Public Health and the Environment, Bilthoven, Netherlands,. available from: http://www.rivm.nl/bibliotheek/rapporten/711701025.html.
UN-ECE 1998, Protocol on Heavy Metals, (http://www.unece.org/env/lrtap/hm_h1.htm).
US EPA 1995, Technical Guidance Manual, Assessing Dermal Exposure from Soil, US EPA Region 3, available from: http://www.epa.gov/reg3hwmd/risk/human/info/solabsg2.htm.
US EPA 1997, Mercury Study Report to Congress, 1997.
US EPA 2004, Risk Assessment Guidance for Superfund, Volume I: Human Health Evaluation Manual (Part E, Supplemental Guidance for Dermal Risk Assessment), Final, EPA/540/R-99/005, OSWER 9285.7-02EP, July 2004.
US EPA (IRIS 2012). Data and information available from the Integrated Risk Information System, an online database, available from http://www.epa.gov/iris/.
WHO 1989, Environmental Health Criteria 86, Mercury, International Programme on Chemical Safety, United Nations Environment Programme, International Labour Organisation, World Health Organization.
WHO 1990, Methylmercury, Environmental Health Criteria 101, WHO 1990, available from: http://www.inchem.org/documents/ehc/ehc/ehc101.htm.
WHO 1991, Environmental Health Criteria 118, Inorganic Mercury, International Programme on Chemical Safety, United Nations Environment Programme, International Labour Organisation, World Health Organization.
WHO 2000a, Safety evaluation of certain food additives and contaminants, Fifty-third meeting of the Joint FAO/WHO Expert Committee on Food Additives (JECFA), WHO Food Additive Series 44, Geneva, World Health Organization, available at: http://www.inchem.org/documents/jecfa/jecmono/v44jec13.htm.
WHO 2000b, Air Quality Guidelines for Europe, 2nd edn, WHO Regional Office for Europe, Copenhagen. WHO European Publication Series No. 91.
WHO 2003, Concise International Chemical Assessment Document 50 (CICAD 50), Elemental Mercury and Inorganic Mercury Compounds: Human Health Aspects, World Health Organization, Geneva.
WHO 2004, Safety evaluation of certain food additives and contaminants: methylmercury (addendum), Joint FAO/WHO Expert Committee on Food Additives (JECFA). Sixty-first meeting, Rome, 10-19 June 2003. WHO Food Additive Series 52. Geneva: World Health Organization. Available at: http://www.inchem.org/documents/jecfa/jecmono/v52je23.htm.
WHO 2011a, Evaluation of certain contaminants in food, seventy-second report of the Joint FAO/WHO Expert Committee on Food Additives (JECFA), WHO technical report series; no. 959.
WHO 2011b, Guidelines for drinking-water quality, 4th edition, World Health Organization, Geneva available from http://www.who.int/water_sanitation_health/dwq/chemicals/en/index.html.
Several comprehensive reviews of nickel in the environment and its toxicity to humans are available and should be consulted for more detailed information not presented in this summary (ATSDR 1997; ATSDR 2005; WHO 1991; EA 2009a). The following provides a summary of the key aspects of nickel that are relevant to the derivation of a soil HIL.
Nickel is a silvery white metal that is stable under environmental conditions. It occurs naturally in the Earth's crust. It is the 24th most abundant element and is primarily found as oxides or sulfides (ASTDR 1997). Nickel is extracted from mined ore via pyro- and hydrometallurgical refining processes. Most nickel is used for the production of stainless steel and other nickel alloys with high corrosion and temperature resistance. The primary sources of nickel emissions into the atmosphere are the combustion of coal and oil for heat or power generation, the incineration of waste and sewage sludge, nickel mining and primary production, steel manufacture, electroplating and cement manufacturing (WHO 1991).
The chemistry of nickel is complex, and the toxicological properties of the various compounds depend on physicochemical characteristics, surface chemistry, solubility, geological history. Hence it is important that any site specific assessment of nickel consider these issues.
The derivation of the previous HIL (HIL A = 600 mg/kg) is presented by Turczynowicz & Sabordo (1996). In summary, the HILs were derived on the basis of the following:
Ingestion of soil and dust is considered the most significant pathway of exposure for inorganics in soil. The consideration of bioavailability and inclusion of other exposure pathways in the derivation of a soil HIL has been further reviewed, as noted below.
Bioavailability has not been considered in the previous HIL, as insufficient data is available to adequately define the bioavailability of the different forms of nickel from soil. On this basis, a default approach of assuming 100% oral (and inhalation) bioavailability has been adopted in the derivation of an HIL.
It is noted that the rate of nickel absorption from the gastrointestinal tract is dependent on its chemical form. While soluble nickel compounds (e.g. NiSO4) are better absorbed than relatively insoluble ones, the contribution of the poorly soluble compounds to total nickel absorption may be more significant, since they are more soluble in the acidic gastric fluids. In human volunteers who ingested nickel sulfate in the drinking water or food, at doses of between 12 and 50 µg/kg body weight (one treatment), the amount of nickel absorbed averaged 27±17% of the dose ingested in water compared with 0.7±0.4% of the same dose ingested in food (WHO 1991). These issues should be addressed in a site-specific assessment.
Nickel is a potent skin sensitiser, and as many as 1–4% of men and 8–20% of women in the general population may be nickel-sensitive. Both oral and dermal exposures to nickel can cause hypersensitivity reactions of the skin. There has been a limited number of studies on the dermal absorption of nickel through human skin and even fewer examining uptake from soil. The Environment Agency (EA 2009a) reviewed the available studies and recommended the use of a value of 0.005 (0.5%), based on a study by Moody et al. (2009).
Moody et al. (2009) measured in vitro dermal absorption of radioactive nickel chloride through human breast skin over a 24-hour period with and without a spiked commercial soil. It is noted that several studies have noted that most nickel applied as a soluble salt is bound within the skin and does not reach systemic circulation though, until this effect is better documented, the dermal absorption value from Moody et al. (2009) has been adopted in the derivation of a soil HIL.
It is noted that US EPA (2004) has recommended the use of a gastrointestinal absorption factor (GAF) of 4% for nickel based on a diet study in rats used in the derivation of the oral RfD. Little supporting information is available on the basis for the GAF recommended by US EPA. The recommended oral TRV is derived from WHO (2008) as used in the derivation of the guidelines for drinking water. The TRV is based on drinking water studies in (fasted) nickel-sensitised humans, consistent with the TRV derived from a two-generation drinking water rat study. As the study basis for the GAF differs from that relevant to the TRV adopted, and insufficient data is available on the GAF to determine its relevance to the oral TRV recommended, the application of the GAF has not been considered in the derivation of the soil HIL.
Nickel is not volatile and inhalation exposures associated with particulates outdoors and indoors are expected to be of less significance than ingestion of soil. While likely to be negligible, potential inhalation exposures associated with dust have been considered in the HIL derived.
A detailed review of the plant uptake of nickel is presented in EA (2009b). This review considered studies that are based on the uptake of nickel into green vegetables, root vegetables, tuber vegetables, herbaceous fruit, shrub fruit and tree fruit. The review provides recommendations on soil-to-plant uptake factors that are relevant for these types of produce. The recommendations from this review have been considered in the derivation of a residential HIL A and are summarised below for the range of crops considered:
Produce Group | Plant Uptake Factors (mg/kg produce fresh weight per mg/kg soil) (EA, 2009b) |
Green vegetables | 0.0038 |
Root vegetables | 0.0043 |
Tuber vegetables | 0.0019 |
Tree fruit | 0.0034 |
It is noted that the inclusion of home-grown produce in the calculations presented for HIL A results in some double counting of intakes from fruit and vegetable produce (also included in background intakes). To address this in the derivation of HIL A, half the intake estimated to be derived from home-grown produce is assumed to be already accounted for in the total background intake (noted below).
Review of current information from Australia indicates the following:
IARC (2012) classified nickel compounds a Group 1—carcinogenic to humans. The IARC working group noted that the overall evaluation of nickel compounds as a group was undertaken on the basis of the combined results of epidemiological studies, carcinogenicity studies in experimental animals, and several types of other relevant data supported by the underlying assumption that nickel compounds can generate nickel ions at critical sites in their target cells.
It is noted that US EPA has classified nickel refinery dust as Group A—human carcinogenic.
The toxicity of nickel is complex and appears to differ via the different routes of exposure and hence the following addresses oral exposures separately from inhalation exposures.
Review in WHO (2011) concluded that there was no substantial evidence that nickel compounds may produce cancers other than in the lung or nose in occupationally exposed persons. Limited animal studies on carcinogenic effects after oral exposures to nickel compounds did not show any significant increase in tumours. Review by EA (2009b) noted that while not all expert groups (WHO, US EPA, EU) have explicitly concluded that there is no carcinogenic concern from ingested nickel, none of those evaluating oral exposure concluded that a non-threshold approach should be undertaken. Hence the assessment of oral intakes on the basis of a threshold approach is reasonable. The following quantitative values are available from Level 1 Australian and International sources:
Source | Value | Basis/Comments |
Australian | ||
ADWG (NHMRC 2011) | TDI = 0.005 mg/kg/day | The ADWG (NHMRC 2011) derived a health-based guideline of 0.02 mg/L based on NOEL of 5 mg/kg/day associated with organ-to-body-weight ratios in a 2-year rat study and an uncertainty factor of 1000. An additional factor of 10 was not included to address carcinogenicity as this was only relevant for inhalation exposures, not oral exposures. |
International | ||
WHO (2011) | TDI = 0.012 mg/kg/day | The current WHO DWG (2011), based on a review conducted in 2005, derived a guideline of 0.07 mg/L based on a TDI of 0.012 mg/kg/day derived from a LOAEL of 0.012 mg/day established from a study associated with hand eczema in nickel-sensitised volunteers who had fasted prior to administration of the nickel salt (Nielsen et al. 1999). This study (using fasted patients) was considered conservative and an uncertainty factor of 1 was adopted. The review also noted that a general guideline value of 0.13 mg/L could also be derived from a TDI of 0.022 mg/kg/day on the basis of a two-generation study in rats where a NOAEL of 2.2 mg/kg/day could be determined for all end-points studied and an uncertainty factor of 100. |
RIVM (2001) | TDI = 0.05 mg/kg/day | TDI derived on the basis of a NOAEL of 5 mg/kg/day (same study considered in the ADWG) and an uncertainty factor of 100. |
EA (2009b) | TDI = 0.012 mg/kg/day | Adopted the WHO evaluation presented in the WHO DWG (2011). |
TERA (1999) | RfD = 0.008 mg/kg/day | RfD derived for soluble nickel salts on the basis of a LOAEL of 7.6 mg/kg/day associated with kidney effects in rats and an uncertainty factor of 1000. The value derived was in addition to the diet rather than total intake. |
ATSDR (2005) | No oral MRL derived |
|
US EPA (IRIS 2012) | RfD = 0.02 mg/kg/day
| RfD (last reviewed in 1991) based on a NOAEL of 5 mg/kg/day (same study as considered in the ADWG (NHMRC 2011)) and an uncertainty factor of 300. |
Inhalation exposures to nickel are complex, with the toxicity dependent on the form of nickel present. The most recent review of nickel toxicity by EA (2009b) indicates the following with respect to the consideration of inhalation exposures:
With respect to the derivation of a soil HIL, nickel is not volatile and hence inhalation exposures are only relevant to dust intakes. Carcinogenic end points are expected to be of particular importance if they are derived from nickel refinery dust of nickel subsulfide, but dust generated from soil contamination is not likely to be significant and hence the consideration of carcinogenic effects using a non-threshold approach may not be appropriate. It is therefore appropriate to consider intakes on the basis of a threshold approach associated with the most significant end point which includes both carcinogenic and non-carcinogenic effects. These issues were considered by EA (2009b), where a threshold value was recommended that was considered protective of both carcinogenic and non-carcinogenic effects.
The following quantitative threshold values (including guideline values derived to be protective of carcinogenic effects) are available for the assessment of inhalation exposures from Level 1 Australian and International sources:
Source | Value | Basis/Comments |
Australian – No guidelines derived | ||
International | ||
WHO (2000) | GV = 0.025 µg/m3 | Review by WHO (2000) established a range of air guideline values for nickel based on a non-threshold approach with a unit risk derived from occupation studies associated with nickel subsulfate. It has been assumed that the nickel ion is the active agent in the occupational studies and therefore the studies are relevant to all nickel exposures. The guideline value noted here is based on an excess lifetime cancer risk of 1 in 100,000. |
TERA (1999) | RfC = 0.2 µg/m3 | RfC derived on the basis of a benchmark approach using a BMCL10 (HEC) of 0.0017 mg/m3 associated with lung fibrosis from soluble nickel salts in a rat study and an uncertainty factor of 10. This is the same study as considered by the ADTSR (2005). |
RIVM (2001) | TC = 0.05 µg/m3 | Tolerable concentration (TC) derived on the basis of a threshold approach from a NOAEC (HEC) of 0.005 mg/m3 associated with respiratory effects in rats, and an uncertainty factor of 100. |
Health Canada (1994) | TC = 0.0035 µg/m3 TC05 = 0.07 mg/m3 | Tolerable concentration (TC) derived on the basis of a threshold approach from a LOAEC (HEC) of 0.0035 mg/m3 associated with respiratory effects from nickel sulfate in rats, and an uncertainty factor of 1000. Health Canada also derived a tumorigenic concentration of 5%, TC05, based on epidemiology studies of exposed workers at two nickel refineries (based on nickel sulphate and nickel chloride), and derived from the non-threshold doseresponse curves. |
EPAQS (2008) | TC = 0.02 µg/m3 | TC derived assuming a threshold approach is appropriate, based on a LOAEL of 0.02 mg/m3 associated with respiratory tract tumours in occupational nickel exposures, and an uncertainty factor of 1000. TC derived is similar to but slightly lower than that derived on the basis of inflammatory response in experimental animals. |
EA (2009b) | TC = 0.02 µg/m3 | Adopted evaluation of EPAQS (2008), noting the value derived is protective of carcinogenic and non-carcinogenic effects. |
OEHHA (2009) | REL = 0.05 µg/m3 | Chronic inhalation reference exposure level (REL) for nickel and nickel compounds (except nickel oxide where a higher REL is derived) based on a NOAEL (HEC) of 0.0016 mg/m3 associated with respiratory/lung effects in a 104-week rat study, and an uncertainty factor of 30. OEHHA also provide a non-threshold unit risk for nickel and compounds. |
ATSDR (2005) | Inhalation MRL = 0.09 µg/m3 | Chronic inhalation MRL derived on the basis of a NOAEL (HEC) of 0.0027 mg/m3 associated with lung effects in rats, and an uncertainty factor of 30. |
US EPA (IRIS 2012) | GV = 0.04 µg/m3 | Review by the US EPA (last reviewed in 1991) established a range of air guideline values for nickel based on a non-threshold approach with a unit risk derived from occupation studies associated with nickel refinery dust. The guideline value noted here is based on an excess lifetime cancer risk of 1 in 100,000. |
With respect to oral exposures, the more recent review by WHO (2011) is considered appropriate (and most current) and adequately protective of the most critical health effects. The threshold value recommended is considered adequately protective of hypersensitivity responses that may be associated with oral (and dermal) exposures.
With respect to inhalation exposures a number of evaluations are available that consider LOAELs/NOAELs that are similar, with the application of different uncertainty factors. It is recommended that the evaluation provided by EA (2009b) be adopted, where the lower threshold value of 0.02 µg/m3 is adopted, and is consistent with guidelines derived using a non-threshold approach (at an excess lifetime cancer risk level of 1 in 100,000).
On the basis of the discussion above, the following toxicity reference values (TRVs) have been adopted for nickel in the derivation of HILs:
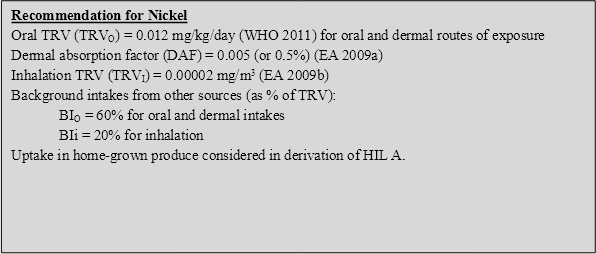
On the basis of the above, the following HILs have been derived for nickel (refer to Appendix B for equations used to calculate the HILs and Appendix C for calculations):
HIL Scenario | HIL (mg/kg) | Percentage Contribution from Exposure Pathways | |||
Ingestion of Soil/Dust | Ingestion of Home-grown Produce | Dermal Absorption of Soil/Dust | Inhalation (dust) | ||
Residential A | 400 | 55 | 26 | 4 | 15 |
Residential B | 1200 | 42 | -- | 11 | 47 |
Recreational C | 1200 | 80 | -- | 11 | 9 |
Commercial D | 6000 | 30 | -- | 11 | 59 |
-- Pathway not included in derivation of HIL
ATSDR 1997, Toxicological Profile for Nickel. United States Department of Health and Human Services, Atlanta, Georgia, USA.
ATSDR 2005, Toxicological Profile for Nickel, US Department of Health and Human Services, ATSDR, available from http://www.atsdr.cdc.gov/ToxProfiles/tp.asp?id=245&tid=44.
DEC 2003, Ambient Air Quality Research Project (1996-2001), Internal working paper no. 4, Ambient concentrations of heavy metals in NSW, Department of Environment and Conservation (NSW).EA 2009a, Soil Guideline Values for Nickel in soil, Science report SC05021/Nickel SGV, 2009.
EA 2009b, Contaminants of soil: updated collation of toxicological data and intake values for humans, Nickel, Science report: SC050021/TOX8, May 2009.
EPAQS 2008, Consultation on guidelines for metals and metalloids in ambient air for the protection of human health, May 2008, Department for Environment, Food and Rural Affairs, Expert Panel on Air Quality Standards, London, UK.
FSANZ 2008, The 22nd Australian Total Diet Study, Food Standards Australia and New Zealand.
Health Canada 1994, Nickel and its compounds, Priority Substances List Assessment Report.
IARC 2012, IARC Monographs on the Evaluation of Carcinogenic Risks to Humans, Volume 100. Part C: A Review of Human Carcinogens: Arsenic, Metals, Fibres, and Dusts, World Health Organization and International Agency for Research on Cancer. http://monographs.iarc.fr/ENG/Monographs/vol100C/mono100C-6.pdf.
IARC 1999, IARC Monographs on the Evaluation of Carcinogenic Risks to Humans: Chromium, Nickel and Welding. World Health Organization, International Agency for Research on Cancer 49, Lyons, France.
Moody, RP, Joncas, J, Richardson, M, Petrovic, S & Chu, I 2009, ‘Contaminated Soils (II): In vitro dermal absorption of nickel (Ni-63) and mercury (Hg-203) in human skin’, Journal of Toxicology and Environmental Health, Part A, vol. 72, pp. 551 – 559.
Nielsen, GD, Soderberg, U, Jorgensen, PJ, Templeton, DM, Rasmussen, SN, Andersen, KE & Grandjean, P 1999, ‘Absorption and retention of nickel from drinking water in relation to food intake and nickel sensitivity’, Toxicology and Applied Pharmacology, vol. 154(1), pp. 67–75.
NHMRC 2011, National water quality management strategy. Australian drinking water guidelines, National Health and Medical Research Council, Australia.
OEHHA 2009, Chronic Toxicity Summary, Nickel, Evaluation from OEHHA, current to December 2009, available from: http://www.oehha.org/air/allrels.html.
RIVM 2001, Re-evaluation of human-toxicological Maximum Permissible Risk levels, National Institute of Public Health and the Environment, Bilthoven, Netherlands, available from: http://www.rivm.nl/bibliotheek/rapporten/711701025.html.
TERA 1999, Toxicological Review of Soluble Nickel Salts, prepared for Metal Finishing Association of Southern California, Inc, US Environmental Protection Agency and Health Canada by Toxicology Excellence for Risk Assessment (TERA), March 1999.
Turczynowicz, L & Sabordo, L 1996, ‘Derivation of a Health-based Investigation Level for Nickel’., presented in the proceedings of the Third National Workshop on the Health Risk Assessment and Management of Contaminated Sites, Contaminated Sites Monograph Series, No. 5.
US EPA (IRIS 2012), Data and information available from the Integrated Risk Information System, an online database, available from http://www.epa.gov/iris/.
US EPA 2004, Risk Assessment Guidance for Superfund, Volume I: Human Health Evaluation Manual (Part E, Supplemental Guidance for Dermal Risk Assessment), Final, EPA/540/R-99/005, OSWER 9285.7-02EP, July 2004.
WHO 1991, Environmental Health Criteria 108: nickel, World Health Organization, Geneva, International Programme on Chemical Safety. Available at: http://www.inchem.org/documents/ehc/ehc/ehc108.htm.
WHO 2000, Air quality guidelines for Europe (2nd edn), WHO Regional Publications, European Series 91, World Health Organization Regional Office for Europe, Copenhagen.
WHO 2011, Guidelines for drinking-water quality, 4th edn, World Health Organization, Geneva, available from http://www.who.int/water_sanitation_health/dwq/chemicals/en/index.html.
Several comprehensive reviews of selenium in the environment and its toxicity to humans are available and should be consulted for more detailed information not presented in this summary (ATSDR 2003; WHO 1987; CCME 2007; NHMRC 2006; EA 2009a; EA 2009b). The following provides a summary of the key aspects of selenium that are relevant to the derivation of a soil HIL.
Selenium is a non-metal that is widely but unevenly distributed in the Earth's crust. In its elemental form selenium forms metallic grey to black crystals but in nature it primarily occurs as sulfide minerals or with silver, copper, lead, and nickel minerals. Selenium’s physical and chemical properties are similar to those of sulfur (ATSDR 2003).
Selenium is manufactured as a by-product of copper refining. It is widely used in electronics and photography because of its semiconductor and photoelectric properties. A variety of selenides, selenates and selenium salts are used in pigments, some pharmaceutical products (sodium selenide in anti-dandruff shampoo) and in dietary supplements (ATSDR 2003).
Selenium is considered an essential element and is important for an extensive range of biochemical functions within the body. As such, adverse effects are associated with both deficiency and toxicity associated with excess intake.
No previous HIL has been established for selenium in soil.
Ingestion of soil and dust is considered the most significant pathway of exposure for inorganics in soil. The consideration of bioavailability and inclusion of other exposure pathways in the derivation of a soil HIL has been further reviewed, as noted below.
Insufficient data is available to adequately define the bioavailability of selenium from soil. On this basis, a default approach of assuming 100% oral (and inhalation) bioavailability has been adopted in the derivation of an HIL. It is noted that a site-specific assessment of bioavailability can be undertaken where required.
ATSDR (2003) notes that there is little or no information available on the dermal absorption of selenium sulfides, but selenium disulfides are not believed to be absorbed through intact skin. This is consistent with reviews provided by CCME (2007) and EA (2009a), where dermal absorption of selenium through intact skin has been considered negligible. Based on the limited data available, dermal absorption has been considered negligible in the derivation of soil HIL.
Selenium is not volatile and inhalation exposures associated with particulates outdoors and indoors are expected to be of less significance than ingestion of soil. While likely to be negligible, potential inhalation exposures associated with dust have been considered in the HIL derived.
A detailed review of the plant uptake of selenium is presented by EA (2009b). This review considered studies that are based on the uptake of selenium into green vegetables, root vegetables, tuber vegetables and herbaceous fruit. No data was available on plant uptake into shrub fruit and tree fruit. The review provides recommendations on soil-to-plant uptake factors that are relevant for these types of produce. The recommendations from this review have been considered in the derivation of a residential A HIL and are summarised below for the range of crops considered:
Produce Group | Plant Uptake Factors (mg/kg produce fresh weight per mg/kg soil) (EA, 2009b) |
Green vegetables | 0.0108 |
Root vegetables | 0.0036 |
Tuber vegetables | 0.00083 |
Tree fruit | 0.003 |
It is noted that the inclusion of home-grown produce in the calculations presented for HIL A results in some double counting of intakes from fruit and vegetable produce (also included in background intakes). To address this in the derivation of HIL A, half the intake estimated to be derived from home-grown produce is assumed to be already accounted for in the total background intake (noted below).
Background intakes of selenium have been estimated by EA (2009a), where intakes from food dominated the total intake. Oral intakes by adults from background sources were estimated to be 34 µg/day from food and 1 µg/day from water. Inhalation intakes were estimated to be 0.06 µg/day based on an average ambient air concentration of 3 ng/m3.
Review of current information from Australia indicates the following:
The International Agency for Research on Cancer (IARC 1987) has classified selenium as Group 3—not classifiable.
It is noted that US EPA has classified selenium as Group D—not classifiable.
Insufficient information is available to adequately assess selenium for carcinogenicity. Review by CCME (2007) notes that the available carcinogenicity studies with selenates, selenites and organic selenium compounds have shown negative results. The only selenium compound found to be carcinogenic to experimental animals is selenium sulphide, noted to be not readily present in food and the environment. Selenium supplementation has been shown to significantly inhibit tumours induced by chemicals, viruses and UV radiation.
Reviews on genotoxicity are mixed. Review by CCME (2007) and ATSDR (2003) suggests the available data on genotoxicity of selenium compounds is inconclusive, with studies showing inorganic selenium compounds having both genotoxic and anti-genotoxic effects, with anti-genotoxic effects generally occurring at lower exposure levels than the genotoxic effects. Review by EA (2009a) suggests that some selenium compounds have given indications of genotoxic effects when administered orally to laboratory animals. However, there is evidence that selenium compounds have given rise to genotoxicity by the production of reactive oxygen species; thus, it has been concluded that the genotoxic effect of selenium is likely to have a threshold.
On the basis of the available information, the consideration of a threshold approach for the quantification of selenium intakes is considered reasonable. It is noted that since selenium is an essential element, a number of the threshold values available are associated with recommended dietary intakes (RDIs) or adequate intake (AI) and associated upper limits (ULs) based on available studies. It is noted that in reviewing the available information, threshold values such as ADIs or RfDs should lie between the RDI or AI and the UL established for selenium intakes. ADIs or RfDs that are lower than the RDI or AI are considered overly conservative and may lead to deficiency. The following provides a summary of quantitative values are available from Level 1 Australian and International sources:
Source | Value | Basis/Comments |
Australian | ||
ADWG (NHMRC 2011) | ADI = 0.24 mg/day or 0.003 mg/kg/day for 70 kg adult | The ADWG (NHMRC 2011) derived a health-based guideline of 0.01 mg/L based on an ADI of 0.24 mg/day derived from review of toxic effects from a 2-year study on 140 people (1991 study). For an adult this is equivalent to an ADI of 0.003 mg/kg/day. |
FSANZ (2003 & 2008) | TL = 0.0125 mg/kg/day UL (infants) = 0.007 mg/kg/day UL (adults) = 0.4 mg/day equivalent to 0.006 mg/kg/day for 70 kg adult | Tolerable limit (TL) for selenium considered in the evaluation of dietary exposures to selenium in 20th ATDS (FSANZ 2003). Upper limit for infants and adults considered in the 22nd ATDS (FSANZ 2008) based on the evaluation provided by NHMRC (2006). Also note RDI and AI noted below from NHMRC (2006). |
NHMRC (2006) | AI = 0.0120.015 mg/day for infants RDI = 0.0250.06 mg/day for children UL = 0.0450.06 mg/day for infants and 0.090.4 mg/day for infants and children, based on 0.007 mg/kg/day. RDI = 0.0650.075 mg/day for adults UL = 0.4 mg/day for adults (including pregnant women) equivalent to 0.006 mg/kg/day for 70 kg adult | Upper limit (UL) for infants based on a NOAEL from studies showing human milk concentrations are not associated with adverse effects, and an uncertainty factor of 1. There is no evidence of increased toxicity in older children and adolescents and hence the UL derived for infants is adopted for these age groups.
UL for adults is based on a NOAEL of 0.8 mg/kg/day associated with brittleness and loss of hair and nails, gastrointestinal disturbances, skin rash, fatigue and effects on the nervous system from a population study, and an uncertainty factor of 2 to address sensitive individuals and because of data gaps. |
International | ||
WHO (2011) | UL = 0.4 mg/day | The WHO (2011) review has derived a provisional guideline of 0.04 mg/L based on an upper tolerable intake of 0.4 mg/day. The guideline is considered to be provisional due to uncertainties in the scientific database, however the review notes that it is important to balance recommended intakes with undesirable intakes in setting any guideline level. |
CCME (2007) | UL = 0.0055 mg/kg/day for infants | For potential risks posed at contaminated sites in Canada by exposure to contaminants that are also considered to be essential trace elements, Health Canada recommends the use of ‘Tolerable Upper Intake Levels’ (ULs) as the reference exposure levels for risk assessment. Since selenium is an essential trace element in human health and selenium compounds do not appear to be carcinogenic, the ULs for all life stage groups are proposed for use in the derivation of the human health soil quality guidelines for selenium. The UL noted here is the lower value relevant to infants (the most sensitive age group). |
EA (2009a) | UL = 0.45 mg/day or 0.006 mg/kg/day for a 70 kg adult | A Safe Upper Level of 450 μg of total selenium (‘ionic selenium’) per day was established. This was derived from a LOAEL of 910 μg Se day-1 for mild signs of selenosis (changes in the hair and nails) indicated in an exposed Chinese population, and the use of an uncertainty factor (UF) of 2 to convert the LOAEL for ‘slight effects’ to a NOAEL (no observed adverse effect level). As the LOAEL was from a population study, a UF to take into account inter-individual variation was said not to be required. |
ATSDR (2003) | MRL = 0.005 mg/kg/day | Chronic oral MRL derived for selenium based on a NOAEL of 0.015 mg/kg/day for disappearance of symptoms of selenosis in recovering individuals, and an uncertainty factor of 3 to account for sensitive individuals. |
US EPA (IRIS 2012) | RfD = 0.005 mg/kg/day
| RfD (last reviewed in 1991) based on a NOAEL of 0.015 mg/kg/day (same study as considered by ATSDR), and an uncertainty factor of 3. |
There is unanimity among the expert groups that the heavily exposed population within mainland China offers the best opportunity of defining the toxicological consequences of long-term oral exposure to ‘selenium’—a term which would appear to include all selenium compounds other than the sulphides. The available threshold values for selenium are based on these studies and typically relate to an upper limit (UL); that is, an intake that can be consumed daily over a lifetime without significant risk to human health on the basis of available evidence. The values derived by ATSDR and US EPA are based on a UL from the same studies and they have both considered an uncertainty factor of 3. Review by EA (2009a) suggested that, given the large population group considered in the studies, the use of the uncertainty factor may not be required. There are differences in the interpretation of the various studies used to derived ULs with variability in assumed body weights most significant. Hence there is some variability in the threshold values derived by different organisations.
The value of 0.006 mg/kg/day, the lower UL value recommended/endorsed by NHMRC (2006), is consistent with that derived from CCME (2007) and EA (2009a) and is similar to that derived by ATSDR (2003) and US EPA (IRIS 2012). Hence the UL from NHMRC is considered reasonable for the quantification of oral intakes associated with selenium and is recommended as a TDI for the derivation of a soil HIL.
There are no dermal or inhalation specific values available for selenium therefore the TDI adopted is considered relevant for all intakes.
On the basis of the discussion above, the following toxicity reference values (TRVs) have been adopted for selenium in the derivation of HILs:

On the basis of the above, the following HILs have been derived for selenium (refer to Appendix B for equations used to calculate the HILs and Appendix C for calculations):
HIL Scenario | HIL (mg/kg) | Percentage Contribution from Exposure Pathways | |||
Ingestion of Soil/Dust | Ingestion of Home-grown Produce | Dermal Absorption of Soil/Dust | Inhalation (dust) | ||
Residential A | 200 | 62 | 38 | -- | <1 |
Residential B | 1400 | 100 | -- | -- | <1 |
Recreational C | 700 | 100 | -- | -- | <1 |
Commercial D | 10 000 | 100 | -- | -- | <1 |
-- Pathway not included in derivation of HIL
ATSDR 2003, Toxicological Profile for Selenium, US Department of Health and Human Services, ATSDR, available from http://www.atsdr.cdc.gov/ToxProfiles/tp.asp?id=153&tid=28.
CCME 2007, Canadian Soil Quality Guidelines : Selenium, Environmental and Human Health. Scientific Supporting Document. Canadian Council of Ministers of the Environment, Winnipeg.
DEC 2003, Ambient Air Quality Research Project (1996-2001), Internal working paper no. 4, Ambient concentrations of heavy metals in NSW, Department of Environment and Conservation (NSW).
EA 2009a, Contaminants in soil: updated collation of toxicological data and intake values for humans, Selenium. Science report: SC050021, Environment Agency, Bristol, UK.
EA 2009b. Supplementary information for the derivation of SGV for selenium, Science report: SC050021, Environment Agency, Bristol, UK.
FSANZ 2003, The 20th Australian Total Diet Survey. A total diet survey of pesticide residues and contaminants, Food Standards Australia and New Zealand.
FSANZ 2008, The 22nd Australian Total Diet Study, Food Standards Australia and New Zealand.
FSANZ 2011, The 23rd Australian Total Diet Study, Food Standards Australia and New Zealand.
IARC 1987, - Summaries & Evaluations, Selenium and Selenium Compounds, Supplement 7 (1987), p.71, International Agency for Research on Cancer (IARC).
NHMRC 2006, Nutrient Reference Values for Australia and New Zealand including Recommended Dietary Intakes, National Health and Medical Research Council (NHMRC), published in 2006, Commonwealth of Australia, Canberra, Australia.
NHMRC 2011, National water quality management strategy. Australian drinking water guidelines, National Health and Medical Research Council, Australia.
US EPA (IRIS 2012). Data and information available from the Integrated Risk Information System, an online database, available from http://www.epa.gov/iris/.
WHO 1987, Selenium, Environmental Health Criteria 58, International Programme on Chemical Safety, World Health Organization, Geneva, accessed online at: http://www.inchem.org/documents/ehc/ehc/ehc58.htm.
WHO 2011, Guidelines for drinking-water quality, 4th edn, World Health Organization, Geneva available from http://www.who.int/water_sanitation_health/dwq/chemicals/en/index.html.
Several comprehensive reviews of zinc in the environment and its toxicity to humans are available and should be consulted for more detailed information not presented in this summary (ATSDR 2005; WHO 2001; NEHF 1997). The following provides a summary of the key aspects of zinc that are relevant to the derivation of a soil HIL.
Zinc is ubiquitous in the environment and occurs in the Earth’s crust at an average concentration of about 70 mg/kg. Zinc is not found in elemental form in nature, and occurs in the +2 oxidation state primarily as various minerals such as sphalerite (zinc sulfide), smithsonite (zinc carbonate), and zincite (zinc oxide). Fifty-five zinc-containing minerals are known to exist. In its pure elemental (or metallic) form, zinc is a bluish-white shiny metal (WHO 2001).
Most rocks and many minerals contain zinc in varying amounts. Commercially, sphalerite (ZnS) is the most important ore mineral and the principal source of the metal for the zinc industry (WHO 2001). Inorganic zinc salts have numerous commercial uses. Zinc oxide is used in the rubber industry as a vulcanisation activator and accelerator and to slow down oxidation, and also as a reinforcing agent, heat conductor, pigment, UV stabiliser, supplement in animal feeds and fertilisers, catalyst, chemical intermediate, and mildew inhibitor. Zinc sulfate is used in rayon manufacture, agriculture, zinc plating, and as a chemical intermediate and mordant. Zinc chloride is used in smoke bombs, in cements for metals, in wood preservatives, in flux for soldering, in the manufacture of parchment paper, artificial silk, and glues, as a mordant in printing and dye textiles, and as a deodorant, antiseptic and astringent. Zinc chromate is used as a pigment in paints, varnishes, and oil colours. In addition, zinc phosphide is used as a rodenticide while zinc cyanide is used in electroplating.
Zinc is an essential element for all living things, including man. Zinc-containing proteins and enzymes are involved in every aspect of metabolism, including the replication and translation of genetic material. Hence adverse effects are associated with deficiency and toxicity associated with excess intake. Zinc deficiency has been reported to affect children of many countries while other groups identified at particular risk are women of child-bearing age and the elderly. The main cause of human zinc deficiency is consumption of diets that contain little highly bioavailable zinc (NEHF 1997).
The derivation of the previous HIL (HIL A = 7000 mg/kg) for zinc is presented by Imray & Neville (1996). In summary, the HIL was derived on the basis of the following:
Ingestion of soil and dust is considered the most significant pathway of exposure for inorganics in soil. The consideration of bioavailability and inclusion of other exposure pathways in the derivation of a soil HIL has been further reviewed, as noted below.
Insufficient data isavailable to adequately define the bioavailability of zinc from soil as it will be dependent on the form present. On this basis a default approach of assuming 100% oral (and inhalation) bioavailability has been adopted in the derivation of an HIL.
The toxicokinetic properties of ingested zinc have been extensively studied. The bioavailability of zinc from specific foods ranges from 1040%. Absorption from the gastrointestinal tract is homeostatically controlled. Under normal physiological conditions 2030% of ingested zinc is absorbed (Imray & Neville 1996). It is expected that bioavailability from soil will depend on the form present and may be considered further in a site-specific assessment.
Imray & Neville (1996) note that dermal absorption of zinc occurs, but the mechanism is undefined and studies are limited. Certain zinc compounds (such as acetate and chloride) are skin irritants, though zinc oxide is a common constituent in many topical skin creams, such as sunscreen/block. Data presented by WHO (2001) shows some (low) dermal absorption of zinc in animal studies. Based on the limited data available, it is reasonable to consider that dermal absorption may be more than negligible. Limited data is available regarding the dermal absorption of zinc from soil and hence a default value of 0.1% has been considered. The default value of 0.1% is the lower end of the range considered relevant for metals, as presented by US EPA (1995).
Zinc is not volatile and inhalation exposures associated with particulates outdoors and indoors are expected to be of less significance than ingestion of soil. While likely to be negligible, potential inhalation exposures associated with dust have been considered in the HIL derived.
An important aspect of the potential for plant uptake of zinc is the potential for zinc to be present in soil water. The concentration of zinc in soil solution is dependent on the form and amount of zinc present in the soil, solubility of the particular zinc compound, and the extent of adsorption. Zinc compounds vary significantly in solubility (CCME 1999).
Geochemical differences in zinc concentrations in soil and autonomic selection processes during the evolution of plants result in a great variation in zinc demand and zinc content between plant species and between plant genotypes of the same species. As a general rule, plants from environments poor in zinc are characterised by low zinc concentrations, those from zinc-enriched environments by high concentrations (WHO 2001).
Zinc toxicity to plants affects general physiological processes, e.g. transpiration, respiration and photosynthesis, and plant development in general can be visibly inhibited. The critical leaf tissue concentration of zinc at which growth is affected was found for many plant species to be between 200 and 300 mg/kg dry matter (WHO 2001). However, zinc phytotoxicity in leaves can depend to a large extent on the plant species, the age of the leaf and other factors such as exposure period and exposure concentration.
An extensive literature review of plant uptake of zinc has not been undertaken, and few quantitative values are available that are specifically relevant to different types of edible produce, but the potential for plant uptake has been considered in the derivation of the HIL A. The approach adopted by MfE (2011) in the derivation of a soil guideline where plant phytotoxicity may be of importance has been adopted in the derivation of an HIL. This approach considered potential intakes associated with consumption of home-grown produce in soil concentrations that are not phytotoxic (based on the lower limit of phytotoxicity) as part of the overall intake from other sources.
For zinc, plant growth is considered to be affected at concentrations between 200300 mg/kg tissue concentration. To estimate the additional background intake, a child’s produce consumption (0.048 kg DW[3]/day) was multiplied by 200300 mg/kg and divided by the child body weight of 15.5 kg to obtain the maximum additional background daily intake for 100 % of produce being home-grown. For the consumption of 10% home-grown produce this results in an additional intake of 0.06 to 0.09 mg/kg/day was considered.
It is noted that the inclusion of home-grown produce in the calculations presented for HIL A results in some double counting of intakes from fruit and vegetable produce. The amount of double counting cannot be easily determined; however, to partially address this issue, the lower intake value calculated for zinc from home-grown produce has been included in the derivation of HIL A.
Review of current information from Australia indicates the following:
The International Agency for Research on Cancer (IARC) has not evaluated zinc with respect to human carcinogenicity.
It is noted that US EPA has evaluated zinc in the more recent 2005 review (available on IRIS). The evaluation notes ‘there is inadequate information to assess carcinogenic potential of zinc’ because studies of humans occupationally-exposed to zinc are inadequate or inconclusive, adequate animal bioassays of the possible carcinogenicity of zinc are not available, and results of genotoxic tests of zinc have been equivocal.
Insufficient information is available to adequately assess zinc for carcinogenicity. WHO (2001) notes that the weight of evidence supports the conclusion that zinc is not genotoxic or teratogenic. At high concentrations zinc can be cytotoxic. More recent reviews of genotoxicity studies for zinc by EU (2003) and US EPA (2005) are equivocal. The EU (2003) review concluded that in vitro tests indicated that zinc has a genotoxic potential, while the in vivo studies as presented are inconclusive, with sometimes contradictory results. However, there are indications of some weak clastogenic, and possibly aneugenic effects following zinc exposure. The relevance of these findings needs to be clarified.
On the basis of the available information, the consideration of a threshold approach for the quantification of zinc intakes is considered reasonable. It is noted that since zinc is an essential element, a number of the threshold values available are associated with recommended dietary intakes (RDIs) or adequate intake (AI) and associated upper limits (ULs) based on available studies. It is noted that in reviewing the available information, threshold values such as TDIs or RfDs should lie between the RDI or AI and the UL established for zinc intakes. TDIs or RfDs that are lower than the RDI or AI are considered overly conservative and may lead to deficiency. The following quantitative values are available from Level 1 Australian and International sources:
Source | Value | Basis/Comments |
Australian | ||
ADWG (NHMRC 2011) | No health-based guideline established | The ADWG (NHMRC 2011) has not derived a health-based guideline for zinc, with the current guideline based on aesthetic considerations (taste). |
FSANZ (2003) | TDI = 1 mg/kg/day | TDI noted to be derived from WHO (refer to comments provided below from JECFA). |
NHMRC (2006) | Infants: AI = 2-3 mg/day UL = 45 mg/day 1-3 years: RDI = 3 mg/day UL = 7 mg/day Children 418 yrs: RDI = 413 mg/day UL= 1235 mg/day Adults: RDI = 814 mg/day UL = 3540 mg/day including during pregnancy and lactation | The upper limit (UL) applies to total zinc intake from food, water and supplements (including fortified food). The UL for infants is based on a NOAEL at a level of 5.8 mg zinc/L of infant formula fed for 6 months, equal to a NOAEL of 4.5 mg/day at 0.78 L milk per day. A UF of 1 was applied, given the length and quality of the study and the fact that there is no evidence of harm from intakes of formula at 5.8 mg zinc/L. Rounding down, a UL of 4 mg was therefore set for infants of 0–6 months. As there was no data for older children and adolescents, this figure was adjusted on a body weight basis, for older infants, children and adolescents and values rounded down. The adverse effect of excess zinc on copper metabolism has been identified as the critical effect on which to base the adult UL. This is based on the consistency of findings from a number of studies where the sensitivity of the marker used (erythrocyte copperzinc superoxide dismutase) and the quality and completeness of the database for this end point. A LOAEL of 60 mg/day was adopted (and is supported by other studies). A UF of 1.5 is applied to account for inter-individual variability in sensitivity and for extrapolation from a LOAEL to NOAEL. As reduced copper status is rare in humans, a higher UF was unjustified. The adult UL was therefore set at 40 mg/day. |
International | ||
WHO DWG (2011) | No health-based guideline established | The current WHO DWG (2011) derived a guideline of 3 mg/L based on aesthetic issues. The review notes that in 1982, JECFA proposed a daily dietary requirement of zinc of 0.3 mg/kg of body weight and a provisional maximum tolerable daily intake (PMTDI) of 1.0 mg/kg of body weight. The daily requirement for adult humans is 15–22 mg/day. Hence it was concluded that the derivation of a health-based guideline value is not required. |
JECFA (WHO 1982) | TDI = 1 mg/kg/day | Provisional maximum tolerable daily intake estimated to be 1 mg/kg/day based on the evaluation that there is a wide margin between nutritionally required amounts of zinc and toxic levels. Clinical studies in which up to 600 mg of zinc sulfate (equivalent to 200 mg elemental zinc) has been administered daily in divided doses for a period of several months, provides a basis for the evaluation. |
RIVM (2001) | TDI = 0.5 mg/kg/day | TDI derived on the basis of a LOAEL (adjusted) of 1 mg/kg/day associated with haematological effects in a 1989 human study (from supplements) and a UF of 2. |
ATSDR (2005) | MRL = 0.3 mg/kg/day | Chronic oral MRL derived based on a NOAEL of 0.83 mg/kg/day from the same study considered by RIVM (however interpretation of the study differed) and a UF of 3. |
US EPA (IRIS 2012) | RfD = 0.3 mg/kg/day
| RfD (last reviewed in 2005) based on a LOAEL of 0.91 of 0.015 mg/kg/day, identified as the point of departure associated with haematological effects from a number of oral human studies published from 1984 to 2000 (including the study considered by ATSDR and RIVM) and a UF of 3. |
It would be relevant and consistent to consider potential exposures to zinc in soil on the same basis as considered by FSANZ (also noted in WHO 2011) where dietary intakes are addressed. However it is noted that the upper limit of zinc intakes identified for children by NHMRC (2006) is lower than that considered in the 20th Australian Total Diet Survey (FSANZ 2003), where an upper limit of 7 mg/day for children aged 13 years, equivalent to 0.5 mg/kg/day (based on a 15.5 kg child) is identified. This is the same as derived by RIVM (2001) and is lower than the upper limit recommended for adults of 40 mg/day, equivalent to 0.57 mg/kg/day (based on 70 kg adult). It is recommended that the lower value for children of 0.5 mg/kg/day recommended by NHMRC (2006) be adopted.
It is noted that for the derivation of a soil HIL, where young children are most sensitive, background intakes of zinc for young children (aged 2 years) of 0.4 mg/kg/day exceeds the threshold value derived by US EPA and ATSDR. Hence it would not be appropriate to adopt these threshold values for the derivation of a soil HIL.
There are no dermal or inhalation specific values available for zinc, so the TDI adopted is considered relevant for all intakes.
On the basis of the discussion above, the following toxicity reference values (TRVs) have been adopted for zinc in the derivation of HILs:

On the basis of the above the following HILs have been derived for zinc (refer to Appendix B for equations used to calculate the HILs and Appendix C for calculations):
HIL Scenario | HIL (mg/kg) | Percentage Contribution from Exposure Pathways | |||
Ingestion of Soil/Dust | Ingestion of Home-grown Produce | Dermal Absorption of Soil/Dust | Inhalation (dust) | ||
Residential A | 7400 | 98 | -- | 1 | <1 |
Residential B | 60 000 | 95 | -- | 5 | <1 |
Recreational C | 30 000 | 98 | -- | 2 | <1 |
Commercial D | 400 000 | 93 | -- | 7 | <1 |
-- Pathway not included in derivation of HIL
ATSDR 2005, Toxicological Profile for Zinc. US Department of Health and Human Services, ATSDR, available from: http://www.atsdr.cdc.gov/ToxProfiles/tp.asp?id=302&tid=54.
CCME 1999, Zinc, Canadian Soil Quality Guidelines for the Protection of Environmental and Human Health, Canadian Council of Ministers of the Environment.
DEC 2003, Ambient Air Quality Research Project (1996-2001), Internal working paper no. 4, Ambient concentrations of heavy metals in NSW, Department of Environment and Conservation (NSW).
EU 2003, Scientific Committee on Toxicity, Ecotoxicity and the Environment (CSTEE), Opinion on the results of the Risk assessment of: zinc metal, zinc chloride, zinc sulphate, zinc distearate, zinc phosphate, zinc oxide, Human Health Part, adopted by the CSTEE during the 39th plenary meeting of 10 September, 2003.
FSANZ 2003, The 20th Australian Total Diet Survey, A total diet survey of pesticide residues and contaminants. Food Standards Australia and New Zealand.
FSANZ 2011, The 23rd Australian Total Diet Study, Food Standards Australia and New Zealand.
HSDB (n.d.), Hazardous Substances Data Bank, online database available from: http://toxnet.nlm.nih.gov/cgi-bin/sis/htmlgen?HSDB.
Imray, P & Neville, G 1996, ‘Deriving a Health-Based Investigation Level for Zinc’. presented in the proceedings of the Third National Workshop on the Health Risk Assessment and Management of Contaminated Sites, Contaminated Sites Monograph Series, No. 5.
MfE 2011, Toxicological intake values for priority contaminants in soil, New Zealand Ministry for the Environment, Wellington, New Zealand.
NEHF 1997, Zinc, National Environmental Health Monographs, Metal Series No. 2, National Environmental Health Forum.
NHMRC 2003, Dietary Guidelines for Children and Adolescents in Australia incorporating the Infant Feeding Guidelines for Health Workers, endorsed 10 April 2003, available from: http://www.nhmrc.gov.au/publications/synopses/dietsyn.htm.
NHMRC 2006, Nutrient Reference Values for Australia and New Zealand including Recommended Dietary Intakes, National Health and Medical Research Council (NHMRC), published in 2006, Commonwealth of Australia, Canberra, Australia.
NHMRC 2011, National water quality management strategy. Australian drinking water guidelines, National Health and Medical Research Council, Australia.
RIVM 2001, Re-evaluation of human-toxicological Maximum Permissible Risk levels, National Institute of Public Health and the Environment, Bilthoven, Netherlands, available from: http://www.rivm.nl/bibliotheek/rapporten/711701025.html.
US EPA (IRIS 2012). Data and information available from the Integrated Risk Information System, an online database, available from http://www.epa.gov/iris/.
US EPA 1995, Technical Guidance Manual, Assessing Dermal Exposure from Soil, US EPA Region 3, December 1995, available from: http://www.epa.gov/reg3hwmd/risk/human/info/solabsg2.htm.
US EPA 2005, Toxicological Review of Zinc and Compounds, in support of summary information on the Integrated Risk Information System (IRIS), July 2005.
WHO 1982, WHO Food Additive Series 17, Zinc. Joint FAO/WHO Expert Committee on Food Additives (JECFA). Available from: http://www.inchem.org/documents/jecfa/jecmono/v17je33.htm
WHO 2001, Zinc, Environmental Health Criteria 221, International Programme on Chemical Safety, World Health Organization, Geneva, accessed online at: http://www.inchem.org/documents/ehc/ehc/ehc221.htm.
WHO 2011, Guidelines for drinking-water quality, 4th edn, World Health Organization, Geneva, available from http://www.who.int/water_sanitation_health/dwq/chemicals/en/index.html.
Several comprehensive reviews of cyanide in the environment and its toxicity to humans are available and should be consulted for more detailed information not presented in this summary (ATSDR 2006; WHO 2004 and 2011; RIVM 2001; DEFRA & EA 2002; NICNAS 2010). The following provides a summary of the key aspects of cyanide that are relevant to the derivation of a soil HIL.
Cyanide is a chemical group consisting of one atom of carbon connected to one atom of nitrogen by three molecular bonds. Cyanides can both occur naturally or be man-made and many are powerful and rapid-acting poisons. Hydrogen cyanide and the simple cyanide salts (sodium cyanide and potassium cyanide) are common examples of cyanide compounds. Certain bacteria, fungi, and algae can produce cyanide. In certain plant foods, including almonds, millet sprouts, lima beans, soy, spinach, bamboo shoots and cassava roots (which are a major source of food in tropical countries), cyanides occur naturally as part of sugars or other naturally-occurring compounds (ATSDR 2006).
Cyanide in soil and water predominantly comes from industrial processes. Major sources of cyanide in water includes discharges from metal mining processes, organic chemical industries, iron and steel plants or manufacturers, and publicly owned wastewater treatment facilities. Other cyanide sources include vehicle exhaust, releases from certain chemical industries, burning of municipal waste, and use of cyanide-containing pesticides. Much smaller amounts of cyanide may enter water through stormwater runoff where road salts containing cyanides are used.
Cyanide can be present in soil as cyanide complexes, free cyanide or as the gas hydrogen cyanide. The behaviour of cyanide is complex and the potential for free cyanide to be present should include some consideration of the former source. Review of cyanide in soil from a range of sources (RIVM 2001) identified little free cyanide (or hydrogen cyanide gas) present at former manufactured gasworks sites (with most cyanide in the form of Prussian blue), little free cyanide associated with former metallurgic and photographic industry wastes (where most cyanide present is complexed) and other waste materials.
The lifetime of dumped free cyanide and simple cyanides at high or low concentrations in the soil is limited. At high concentrations, leaching and emanation of free cyanide is dominant initially, together with the formation of metal hexacyanide complexes, generally with iron and/or manganese. Later and/or at low concentrations, free cyanide is reduced by biochemical breakdown. Little free cyanide is liberated from cyanide complexes found in soil (RIVM 2001).
The derivation of the previous HIL (HIL A = 250 mg/kg) for cyanide is presented by Turczynowicz (1993) and NEPC (1999). In summary, the HIL was derived on the basis of the following:
Ingestion of soil and dust is considered the most significant pathway of exposure for inorganics in soil. The consideration of bioavailability and inclusion of other exposure pathways in the derivation of a soil HIL has been further reviewed, as noted below.
Insufficient data is available to adequately define the bioavailability of free cyanide. On this basis, a default approach of assuming 100% oral (and inhalation) bioavailability has been adopted in the derivation of an HIL. It is noted that a site-specific assessment of bioavailability can be undertaken where required and relevant.
Turczynowicz (1993) noted that cyanides are moderately lipid soluble, which allows them to penetrate the epidermis. Some cyanide compounds, such as potassium cyanide, have a corrosive effect on the skin that increases the rate of absorption. In addition, hydrogen cyanide and soluble cyanide salts can be absorbed by the skin. The value of 5% adopted by Turczynowicz (1993) was estimated.
Limited information is available on dermal absorption of free cyanide, however DTSC (2005) has listed a dermal absorption of 0.1 for free cyanide in soil. Limited information is available to support the value of 0.1, though, as data is lacking, the value has been adopted in the derivation of HILs.
Inhalation exposures associated with particulates outdoors and indoors are expected to be of less significance than ingestion of soil. While likely to be negligible, potential inhalation exposures associated with dust have been considered in the HIL derived.
The fate and partitioning of free cyanide in soil to hydrogen cyanide gas has been reviewed. Cyanide behaves somewhat differently in soil with respect to phase partitioning from volatile organics. Phase partitioning (and speciation) depends on the soil pH, ionic strength, complexation and the presence of sunlight (Larsen 2005). As noted by RIVM (2001), little HCN gas has been reported at sites where cyanide (free and/or complexed) is present, particularly sometime after disposal of cyanide wastes. In addition the validity of standard volatilisation models such as the Johnson & Ettinger model (J&E from US EPA 2003) for free cyanide needs to be determined. A more detailed review of free cyanide and relevance of standard vapour models was conducted by RIVM (2001), where the model VOLASOIL (similar to the J&E model) was reviewed in conjunction with field data. It was concluded that HCN gas concentrations in air due to soil contamination are too complex to predict as too many soil factors are involved. On the basis of the above, the generation of HCN gas has not been considered in the derived HILs. The potential presence of HCN gas (and potential inhalation exposures) should be addressed on a site-specific basis.
There is little information available on the presence of free cyanide and cyanide species in plants grown on cyanide-affected soil. Similarly, limited data is available on the concentration of free cyanide and cyanide species in different parts of plants. The most relevant information available relates to phytotoxic levels of cyanide. Based on the available information, RIVM (2001) estimated that the maximum concentration that may be present in plants grown in contaminated soil is 1 mg free cyanide/kg produce. At concentrations higher than this, plants are most likely to be unhealthy, hampered in their growth and not suitable for consumption. In addition, the maximum concentration of free cyanide in soil not affecting seed emergence is 15 mg/kg soil, with laboratory studies showing 27 mg free cyanide/kg soil is phytotoxic to plants.
Free cyanide does not accumulate in healthy plants, with practically all free cyanide taken up by healthy plants converted to asparagines (provided phytotoxicity does not occur). Based on the above, plant uptake of free cyanide is not considered significant and has not been considered in the derivation of HIL A.
Note that there are some cyanogenic plants that release elevated concentrations of free cyanide upon damage to their plant cells (RIVM 2001). The presence of these plants and the phytotoxicity of free cyanide should be considered in any site-specific assessment.
Some levels of cyanide and free cyanide in the Australian environment are provided in the review undertaken by NICNAS (2010). In general, cyanides can occur naturally at low concentrations in ground and surface water with the ADWG (NHMRC 2011) noting that naturally occurring free cyanide in the water supply is usually less than 0.01 mg/L. Concentrations of free cyanide are available for areas near industrial emissions (including former manufacturing plants), mining operations and accidents. However, concentrations relevant to background intakes by the general public away from these areas are not readily available. While background exposure relevant to the general public is difficult to quantify based on limited information, it is not considered reasonable that the background intake is assumed to be negligible (0%).
WHO (2011) notes that even healthy individuals have a small amount of cyanide in their bodies (mainly associated with the breakdown of cyanogenic foods, vitamin B12 and heavy smoking). DEFRA & EA (2002) identified a range of potential intakes from food (4.228 µg/kg/day) and air (0.06 µg/kg/day). Estimates presented by CCME (1997) suggested intakes of free cyanide from air, water and soil may be greater than 0.11 µg/kg/day in infants, lower than estimated by the UK. These intakes vary significantly and have been assumed to comprise approximately 50% of the recommended oral TRV. Background concentrations in air are less than 2% of the recommended inhalation TRV, which are considered to be negligible.
The International Agency for Research on Cancer (IARC) has not classified cyanide and US EPA has classified cyanide as Group D—not classifiable.
The information on free cyanide toxicity should emphasise the high acute toxicity, which also complicates the interpretation of available data and studies relevant to the assessment of chronic effects and establishing quantitative values. While data is limited, the weight of evidence (WHO 2004, US EPA 2010 and ATSDR 2006) suggests that cyanide in not genotoxic and that it induces developmental effects only at doses or concentrations that are toxic to the mothers. Limited/insufficient information is available on carcinogenicity of cyanide. On this basis, consideration of a threshold doseresponse approach is appropriate. The following threshold values are available from Level 1 Australian and International sources:
Source | Value | Basis/Comments |
Australian | ||
ADWG (NHMRC 2011) and former WHO DWG (2003) | TDI = 0.012 mg/kg/day | Derived from a NOEL of 1.2 mg/kg/day from a 6-month feeding study in pigs (Jackson et al. 1986 and Jackson 1988) and a 100-fold safety factor. The cyanide species is not stated in the guidance provided. Review of the study by NICNAS (2010) and WHO (2004) suggested it was not appropriate as the test animals were experimentally compromised. |
NICNAS (2010) | No ADI recommended | No ADI or TDI has been recommended. The review has identified that the most reliable repeated dose study available is from NTP (1993) where a NOAEL of 4.5 mg/kg/day was determined (same study as considered in the WHO (2011) review). |
International | ||
JECFA (WHO 1965) | TDI = 0.05 mg/kg/day | ADI adopted for intakes of cyanide arising from the fumigation of food with HCN. Values derived on the same study as noted by US EPA (IRIS 2012) with consideration of a different uncertainty factor. The value was established in 1965 and has not been replaced. |
WHO (2004) | No values derived | Review of hydrogen cyanide and cyanides by WHO indicated a number of limitations with the available data (particularly with respect to chronic assessments) were identified. A chronic inhalation TC could not be derived due to inadequate data. |
WHO (2011) | TDI = 0.045 mg/kg/day for short term exposure | No drinking water guideline is established by WHO (2011) as cyanide is considered to occur in drinking water at concentrations well below those of health concern. However WHO has identified that cyanide is highly acutely toxic, where they note the following: ‘It is detoxified in the liver by first-pass metabolism following oral exposure. As a consequence, exposure to a dose spread over a longer period, for example through a day, will result in lower toxicity, or higher tolerance, than the same dose given in a single bolus dose. Exposure to high doses can give rise to thyroid toxicity as a secondary effect of exposure due to the inhibition of iodine uptake from the thiocyanate generated through the detoxifying action of rhodanese.’ Hence it is appropriate to establish a short-term guideline rather than a chronic guideline. The review has noted data on acute exposures to cyanide is not suitable for the derivation of a short-term guideline due a high level of uncertainty. However a short-term guideline of 0.5 mg/L has been derived on the basis of NOAEL associated with reproductive effects of 4.5 mg/kg/day from a 90-day (13-week) drinking water study in male rats (NTP 1993), and an uncertainty factor of 100. |
DEFRA & EA (2002) | TDIo = 0.012 mg/kg/day TDIi = 0.0009 mg/kg/day (=0.003 mg/m3) | TDIo derived on the basis of the former WHO DWG, as currently referenced in the ADWG (NHMRC 2011). TDIi derived on the same basis as the current US EPA RfC (with different uncertainty factors). |
RIVM (2001) | TDI = 0.05 mg/kg/day TC = 0.025 mg/m3 | TDI was derived on the basis of a NOAEL of 4.5 mg/kg/day associated with male reproductive effects from a 90-day rat study with well-soluble NaCN salt (which forms free cyanide readily after ingestion), and a 100-fold uncertainty factor (as considered by WHO 2011). This is rounded to the TDI of 0.05 mg/kg/day. TC was derived on the basis of a LOAEL (HEC) of 2.5 mg/m3 based on critical effects to the CNS and thyroid in an occupational study of HCN, and a 100-fold uncertainty factor (same study as considered by US EPA). |
ATSDR (2006) | No chronic MRL Intermediate MRL = 0.05 mg/kg/day | Intermediate MRL (exposures up to 1 year) based on same study and approach considered by WHO (2011). |
OEHHA | RfC = 0.009 mg/m3 | Value based on same study considered by US EPA with consideration of a 300-fold uncertainty factor (less than adopted by US EPA). |
US EPA (2010) | RfD = 0.0006 mg/kg/day RfC = 0.0008 mg/m3 | RfD based a point of departure (BMDL10) of 1.9 mg/kg/day from a 13-week drinking water study in male rats (NTP 1993) and a 3000-fold uncertainty factor. RfC based on a LOAEL (HEC) of 2.5 mg/kg/day based on CNS and thyroid effects in an occupational study (1975) of HCN and application of a 3000-fold uncertainty factor. |
In relation to the evaluations presented above for the assessment of oral exposures, the following can be noted:
With respect to inhalation exposures to HCN, the value available from US EPA (2010) of 0.0008 mg/m3 has been adopted. It is noted that, similar to the derivation of an oral value, the approach adopted by US EPA is conservative (using large uncertainty factors) as the available data in relation to HCN exposures is more limited. Where HCN is expected to be of significance at a site, it should be evaluated on a site-specific basis as vapour intrusion issues may be of importance (not included in the derivation of HILs)).
On the basis of the discussion above, the following toxicity reference values (TRVs) have been adopted for free cyanide in the derivation of HILs:

On the basis of the above, the following HILs have been derived for free cyanide (refer to Appendix B for equations used to calculate the HILs and Appendix C for calculations):
HIL Scenario | HIL (mg/kg) | Percentage Contribution from Exposure Pathways | |||
Ingestion of Soil/Dust | Ingestion of Home-grown Produce | Dermal Absorption of Soil/Dust | Inhalation (dust) | ||
Residential A | 200* | 43 | -- | 57 | <1 |
Residential B | 300 | 16 | -- | 84 | <1 |
Recreational C | 240 | 27 | -- | 73 | <1 |
Commercial D | 1500 | 12 | -- | 88 | <1 |
* Retained existing HIL A of 250 mg/kg in guideline
-- Pathway not included in derivation of HIL
ATSDR 2006, Toxicological Profile for Cyanide, US Department of Health and Human Services, ATSDR, available from http://www.atsdr.cdc.gov/ToxProfiles/tp.asp?id=72&tid=19.
CCME 1997, Cyanide (Free), Canadian Soil Quality Guidelines for the Protection of Environmental and Human Health, Canadian Council of Ministers of the Environment, Winnipeg.
DEFRA & EA 2002, Contaminants in Soil: Collation of Toxicological Data and Intake Values for Humans. Inorganic Cyanide, UK Department of Environment, Food and Rural Affairs and the Environment Agency, Bristol, UK.
DTSC 2005, Human Health Risk Assessment (HHRA) Note, California Department of Toxic Substances Control (DTSC), Human and Ecological Risk Division (HERD).
Jackson, LC, Chandler, JP & Jackson, RT 1986, ‘Inhibition and adaptation of red cell glucose-6-phosphate dehydrogenase in vivo to chronic sublethal dietary cyanide in an animal model’, Human Biology, vol. 58, pp. 67–77.
Jackson, LC 1988, ‘Behavioural effects of chronic sublethal dietary cyanide in an animal model: implications for humans consuming cassava (Manihot esculenta)’, Hum Biol , vol. 60(4), pp. 597–614.
Kamalu, BP 1993, ‘Pathological changes in growing dogs fed on a balanced cassava (Manihot esculenta Crantz) diet’, Br J Nutr, vol. 69(3, pp. 921–934.
Larsen, M 2005, ‘Plant uptake of cyanide’, PhD Thesis, Institute of Environment and Resources, Technical University of Denmark, May 2005.
Manzano, H, de Sousa, AB, Soto-Blanco, B, Guerra, JL, Maiorka, PC & Gorniak, SL 2007, ‘Effects of long-term cyanide ingestion by pigs’, Vet Res Commun , vol. 31(1), pp. 93–104.
NEPC 1999, Schedule B (7a), Guideline on Health-Based Investigation Levels, National Environment Protection (Assessment of Site Contamination) Measure, National Environment Protection Council, Adelaide, Australia.
NICNAS 2010, Sodium Cyanide. Priority Existing Chemical Assessment Report No. 31, NICNAS.
NHMRC 2011, National water quality management strategy. Australian drinking water guidelines, National Health and Medical Research Council, Australia.
NTP (National Toxicology Program) 1993, NTP technical report on toxicity studies of sodium cyanide (CAS No. 143-33-9) administered in drinking water to F344/N rats and B6C3F1 mice. Public Health Service, U.S. Department of Health and Human Services; NTP TR 37; NIH Publication 94-3386. Available online at http://ntp.niehs.nih.gov/ntp/htdocs/ST_rpts/tox037.pdf.
RIVM 2001, Re-evaluation of human-toxicological Maximum Permissible Risk levels, National Institute of Public Health and the Environment, Bilthoven, Netherlands, .available from: http://www.rivm.nl/bibliotheek/rapporten/711701025.html.
Turczynowicz, L 1993,‘ Assessment and Management of Gasworks Sites’, presented in the proceedings of the Second National Workshop on the Health Risk Assessment and Management of Contaminated Sites, Contaminated Sites Monograph Series, No. 2.
US EPA (IRIS 2012), Data and information available from the Integrated Risk Information System, an online database, available from http://www.epa.gov/iris/.
US EPA 2003, User’s Guide for Evaluating Subsurface Vapor Intrusion into Buildings.
US EPA 2010, Toxicological Review of Hydrogen Cyanide and Cyanide Salts, in support of Summary Information on the Integrated Risk Information System (IRIS), EPA/635/R-08/061F.
WHO 1965, Evaluation of the Hazards to Consumers resulting from the use of Fumigants in the Production of Food. Hydrogen Cyanide, JECFA, 1965, available from http://www.inchem.org/documents/jmpr/jmpmono/v65apr09.htm.
WHO 2004, Hydrogen Cyanide and Cyanides: Human Health Aspects. Concise International Chemical Assessment Document 61, available from: http://www.inchem.org/documents/cicads/cicads/cicad61.htm.
WHO 2011, Guidelines for drinking-water quality, 4th edn, World Health Organization, Geneva, available from http://www.who.int/water_sanitation_health/dwq/chemicals/en/index.html.
ADI | acceptable daily intake |
ADWG | Australian Drinking Water Guidelines |
AI | adequate intake |
ANZECC | Australia and New Zealand Environment and Conservation Council |
APVMA | Australian Pesticides and Veterinary Medicines Authority |
ATDS | Australian Total Diet Survey |
ATSDR | Agency for Toxic Substances and Disease Registry |
BA | bioavailability |
BI | background intake |
BMD | benchmark dose |
BMDL | Benchmark dose lower confidence limit |
CCME | Canadian Council of Ministers of the Environment |
CICAD | Concise International Chemicals Assessment Document |
CNS | central nervous system |
DAF | dermal absorption factor |
DW | dry weight |
EA | Environment Agency (England and Wales) |
EHC | Environmental Health Criteria |
EPA | Environment Protection Authority |
FSANZ | Food Standards Australia New Zealand |
GAF | gastrointestinal absorption factor |
HEC | human equivalent concentration |
HED | human equivalent dose |
HIARC | Hazard Identification Assessment Review Committee |
HIL | health investigation level |
HSDB | Hazardous Substances Data Bank |
HSL | health screening level |
IARC | International Agency for Research on Cancer |
IEUBK | Integrated exposure uptake biokinetic model |
IRIS | Integrated Risk Information System |
JECFA | Joint FAO/WHO Expert Committee on Food Additives |
JMPR | WHO/FAO Joint Meeting on Pesticide Residues |
LOAEL | lowest observed adverse effect level |
LOEL | lowest observed effect level |
MF | modifying factor |
MOA | mode (or mechanism) of action |
MRL | minimal risk level |
NEPC | National Environment Protection Council |
NEPM | National Environment Protection Measure |
NHMRC | National Health and Medical Research Council |
NOAEL | no observable adverse effect level |
NOEL | no observable effect level |
NSW DECC | New South Wales Department of Environment and Climate Change |
OCS | Office of Chemical Safety |
PTDI | provisional tolerable daily intake |
PTMI | provisional tolerable monthly intake |
PTWI | provisional tolerable weekly intake |
RAIS | Risk Assessment Information System |
RDI | recommended daily intake |
REL | reference exposure level |
RfC | reference concentration |
RfD | reference dose |
RME | reasonable maximum exposure |
SF | slope factor |
TC | tolerable concentration |
TDI | tolerable daily intake |
TRV | toxicity reference value |
UF | uncertainty factor |
UL | upper limit |
UR | unit risk |
US EPA | United States Environmental Protection Agency |
WHO | World Health Organization |
WHO DWG | World Health Organization Drinking Water Guidelines |
[1] It has been assumed that fruit and vegetable crops contain at least 80% moisture. This value has been used to convert wet weight consumption rates into dry weight consumption rates.
[2] It has been assumed that fruit and vegetable crops contain at least 80% moisture. This value has been used to convert wet weight consumption rates into dry weight consumption rates.
[3] It has been assumed that fruit and vegetable crops contain at least 80% moisture. This value has been used to convert wet weight consumption rates into dry weight consumption rates.